Welcome to the 17th newsletter from the EU POP Centre of Excellence.
In this edition, we will tell you about our future webinar on the POP hybrid metrics and allow you to catch up with previous webinars on the Nvidia profiler and the PyPOP profiling tool. Further training opportunities are then described in the form of Performance Tuning Workshops and POP online training. As usual, the newsletter offers plenty of technical content, as well as details of where you can (virtually) meet POP staff.
If you would like to contribute technical content for this newsletter on the topic of parallel performance profiling, please contact us at pop-helpdesk@bsc.es.
This issue includes:
- POP Webinar - Identifying performance bottlenecks in hybrid MPI + OpenMP software
Wednesday 27th January, 2021, 14:00-14:40 GMT / 15:00-15:40 CET - Past POP webinars
- Nvidia profiler
- PyPOP
- POP Training Goes Virtual
- POP successfully runs the 35th tuning and profiling workshop virtually
- Performance Tuning Workshops
- Upcoming virtual VI-HPS Tuning Workshops
7 to 11 December 2020 | Online using Zoom
8 to 12 February 2021 | Online using Zoom - 2021 Code Performance Series: From analysis to insight
21 January, 18 February, 11 March, 15 April, 20 May, 17 June, 15 July | Online
- Upcoming virtual VI-HPS Tuning Workshops
- Technical Blogs:
- Success story - 588x and 488x Execution Time Speedups of a Volcanic Hazard Assessment Code
- memP - Parallel Heap Profiling
- Observing Application Performance Using the TAU Performance System.
- NAFEMS 20 UK CONFERENCE | 9 – 10 November 2020
- POP continues to seek collaborations with other European Centres of Excellence
- POP Online Training
- POP Out and About – Meet POP members on Virtual Platforms at the event
- 36th International CAE Conference, 30 November – 4 December, 2020
- The POP Helpdesk.
For past editions of the newsletter see the POP newsletter web page.
POP Webinar - Identifying performance bottlenecks in hybrid MPI + OpenMP software
Wednesday 27th January 2021, 14:00-14:40 GMT / 15:00-15:40 CET
Long gone are the days when simple plots of parallel efficiency or parallel scaling were sufficient to understand performance issues in parallel software. It is widely accepted that analysing parallel performance is difficult, in part because of the complexity of modern parallel software, which often includes a mix of thread and process parallelism as well as GPU use, but also because of the complexity of the data generated by modern performance analysis tools.
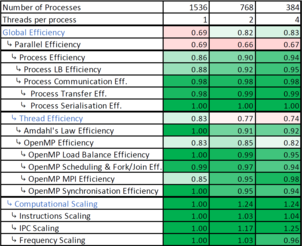 To address this challenge, the POP project is developing a methodology to help code developers more easily analyse trace data and gain meaningful insight into the sources of inefficiency. This methodology is based on the use of a small set of performance metrics, which can be generated easily from trace data, and which point at various specific code performance issues, such as process or thread load imbalance, MPI data transfer, various types of serialisation, and so on.
This webinar describes two complimentary sets of metrics which can be used to identify performance bottlenecks in hybrid MPI + OpenMP software.
Click here to register.
Past POP Webinars
In September, Mozhgan Kabiri Chimeh of Nvidia, gave an excellent talk on Profiling GPU Applications with Nsight Systems, becoming our most popular webinar to date. Catch up at https://pop-coe.eu/blog/17th-pop-guest-webinar-profiling-gpu-applications-with-nsight-systems.
November’s webinar focused on another performance analysis tool. Here, Phil Tooley presented PyPOP – an interactive tool for performance assessment, in which he described how PyPOP can be used to streamline the process of performance analysis. Further details can be found at https://pop-coe.eu/blog/18th-pop-webinar-pypop-an-interactive-tool-for-performance-assessment.
POP Training Goes Virtual
35th VI-HPS Tuning Workshop
Instructors from POP Partners BSC, HLRS, JSC and UVSQ supported the 35th VI-HPS Tuning Workshop, hosted as an online event by the High-Performance Computing Center (HLRS), Stuttgart, Germany, from September 14 to 18, 2020.
The aim of this long-running series of workshops is to train and guide participants in the usage of VI-HPS tools on their own parallel application codes. The close interaction between participants and instructors results in advice on potential optimisations on participants' codes. In return, tool developers receive valuable feedback, which helps direct tool development to user needs, as well as improve tool documentation and ease of use.
Click here to learn more about the workshop.
Performance Tuning Workshops
37th VI-HPS Tuning Workshop
Monday 7th December - Friday 11th December 2020 | Online using Zoom
This workshop organised by VI-HPS, HKHLR and CSC Goethe University Frankfurt will give an overview of the VI-HPS programming tools suite and explain the functionality and effective use of individual tools. In addition, they offer hands-on sessions with expert assistance.
The topics and tools covered are:
- TAU performance system
- MAQAO performance analysis & optimisation
- Score-P instrumentation and measurement
- Scalasca automated trace analysis
- Vampir interactive trace analysis
- Likwid performance tool suite
- PAPI hardware performance counters
- Extra-P automated performance modelling
For more information and to register for this workshop, please click here.
38th VI-HPS Tuning Workshop
Monday 8th February - Friday 12th February 2021 | Online using Zoom
A similar workshop will be organised by POP members Jülich Supercomputing Centre and RWTH Aachen University in February 2021.
For more information for this workshop, please click here.
2021 Code Performance Series: From analysis to insight
21 January, 18 February, 11 March, 15 April | Online
This is an ExCALIBUR Knowledge Integration Activity in collaboration with VI-HPS, Durham’s Department of Computer Science, DiRAC and the N8 Centre of Excellence in Computationally Intensive Research (N8 CIR). Performance analysis is at the core of the development of exascale software – to understand why software performs (or not) is the basis of any informed improvement in that code. Significant resources are put into the development of performance analysis tools by both academia and industry, and significant effort is put into training by tool developers, computing centres and vendors alike. The goals of the workshop are for attendees to:
- Acquire the skillset to run profound performance analyses with a multitude of tools
- Run multifaceted, in-depth performance analyses of particular codes brought in by the participating teams
- Contribute towards a performance analysis landscape review report
- Provide feedback to performance tool developers
- Help us to write down unwritten performance data representation laws and uncover or sketch ways to bring performance analysis data and algorithm know-how together
Click here to learn more about the workshop, including registration.
Technical Blogs
Success story - 588x and 488x Execution Time Speedups of a Volcanic Hazard Assessment Code
The Probabilistic Volcanic Hazard Assessment Work Flow package (PVHA_WF) is a workflow created for the ChEESE CoE Pilot Demonstrator 6 (PD6). It is used to simulate short-term volcanic hazards and the risk of hazardous volcanic particles present at different flight levels over geographical areas. The POP proof of concept resulted in a factor of around 500x speed-up.
Click here to read the article.
memP - Parallel Heap Profiling
memP is a parallel heap profiling library for MPI applications. The intent of memP is to identify the heap allocation that causes a task to reach its memory in use high water mark (HWM) for each task in a parallel job.
Click here to read the article on memP.
Observing Application Performance Using the TAU Performance System
 Instrumenting and measuring an application’s performance is the first step towards optimizing it. Typically, the process of instrumenting the application with source code and build system modifications is viewed as cumbersome, but it does not have to be. Tools such as TAU can operate on an unmodified binary to generate detailed and summary statistics (profiles) and event traces. Observing application performance at the statement, loop and function level is possible on a per-MPI rank, thread and even GPU kernel level using TAU.
Click here to read the article.
NAFEMS 20 UK CONFERENCE | 9 – 10 November 2020
NAFEMS, the International Association for the Engineering Modelling, Analysis and Simulation Community, regularly runs regional, national and international events. A significant number of POP users belong to the engineering community and over the years, POP has attended several NAFEMS events. This November, NAG, one of our commercial partners, represented POP at the NAFEMS UK conference. In this event, which was held virtually, we welcomed visitors to our booth and Fouzhan Hosseini delivered the talk “Parallel Engineering Codes: Performance Optimisation with the POP Methodology”. If you are a NAFEMS member, you can still visit our virtual booth or watch the recording.
To read more, click here.
POP continues to seek collaborations with other European Centres of Excellence
For the last five years, POP has been actively involved in collaborations with the other Centres of Excellence (CoE) for computing applications. These collaborations have varied in their levels of involvement and we have adapted to the needs of each CoE.
In the context of the Horizon2020 EU programme, three new CoEs started in October 2020. PerMedCoE is targeting cell-level simulations in the area of personalised medicine; CoEC addresses fundamental challenges related to combustion technologies; and TREX aims at advancing software solutions in the field of quantum chemistry. Two of these CoEs, PerMedCoE, and CoEC, invited POP experts to their kick-off meeting for a short presentation to the whole consortium, where we explained the different activities carried out by POP to open up possibilities for new collaborations. The partners of both CoEs are looking forward to cooperating with POP and exploring the different opportunities.
CoEC: https://www.hpccoe.eu/index.php/coec/
PerMedCoE: http://www.permedcoe.eu/
TREX: https://trex-coe.eu/
POP Online Training
POP provides a series of short training videos on topics related to performance optimisation and our methodology. The topics covered include:
- The POP metrics: these are how we define the performance of parallel applications and help target optimisation efforts. Learn how to calculate the POP metrics for your application and what performance implications they may have. Click here to learn about POP metrics.
- The Scalasca toolset: one of the tools used within the POP project to identify inefficiencies within parallel codes. Learn how to use this toolset here and how to install the Scalasca toolset on your machine or HPC cluster here.
Click here for a full list of the training topics – more will be added in due course. If you have any specific training needs on parallel performance profiling, feel free to get in touch with us at pop-helpdesk@bsc.es and one of our technical experts will contact you.
POP Out and About
36th International CAE conference | November 30 – December 4 | Virtual Event
POP is participating in the international CAE conference 2020, which is held online from 30th November until 4th December. The conference topic, “At the epicentre of the digital transformation of industry”, shows the importance of high-performance computing for the CAE community as a key enabler for future innovation. If you are attending, make sure you stop by our virtual booth.
In addition to POP, EXCELLERAT and MaX, our fellow CoEs, are present at CAE2020 with a joint virtual booth to share their latest results.
For more information on the conference, please click here.
If you feel that POP should be attending an event, please contact us at pop-helpdesk@bsc.es - suggestions are most welcome!
Apply For Free Help with Code Optimisation
We offer a range of free services designed to help EU organisations improve the performance of parallel software. If you are not getting the performance you need from parallel software or would like to review the performance of a parallel code, please apply for help via the short Service Request Form, or email us to discuss the service further and how it can be beneficial.
These services are funded by the European Union Horizon 2020 research and innovation programme so there is no direct cost to our users.
The POP Helpdesk
Past and present POP users are eligible to use our email helpdesk (pop-helpdesk@bsc.es). Please contact our team of experts for help analysing code changes, to discuss your next steps, and to ask questions about your parallel performance optimisation.