Introduction
Instrumenting and measuring an application’s performance is the first step towards optimizing it. Typically, the process of instrumenting the application with source code and build system modifications is viewed as cumbersome, but it does not have to be. Tools such as TAU can operate on an un-modified binary to generate detailed and summary statistics (profiles) and event traces. Observing application performance at the statement, loop, and function level is possible on a per-MPI rank, thread, and even GPU kernel level using TAU.
TAU is a versatile profiling and tracing toolkit that is widely ported to HPC platforms. In its latest release TAU v2.30 supports GPUs from Intel®, AMD®, and NVIDIA® using Level Zero (for Gen19LP GPUs), ROCm/Rocprofiler, and CUPTI interfaces respectively. It also supports the OpenACC, OpenCL, and the OpenMP Tools (OMPT) interface that is now part of the OpenMP 5.0 standard. All configurations of TAU also support the Kokkos profiling interface [1] by default. These interfaces allow TAU to transparently intercept runtime system calls and measure the performance of key code regions using timer calls and track the arguments that flows through the runtime library functions.
For MPI programs, TAU supports both the MPI Profiling (PMPI) and the MPI Tools (MPI_T) interfaces. The MPI_T interface allows TAU to expose the performance of the MPI runtime in the form of MPI performance variables (PVARs) and allows a user to set MPI_T control variables (CVARs) that modify the behavior of the MPI runtime. Besides direct measurement in the form of probe-based instrumentation interfaces that rely on timer start/stop semantics, TAU also supports indirect performance measurement. Indirect methods include event-based sampling (EBS) where a periodic system timer or hardware performance counter overflow interrupt is used to estimate the performance of different code regions. To map the performance data back to the precise function, source line number, and file name, TAU relies on third party libraries such as GNU Binutils (BFD) and libdwarf. By collecting program counter (PC) samples and attributing these at the statement, function, and file level, we can get a hierarchical view of the performance data where at the outer level, TAU reports the time spent in MPI and other runtimes and within the application, it can focus on the functions and within those, on the loops.
TAU supports callsite tracking as well, using the TAU_CALLSITE=1 environment variable, that can show the time spent in an instrumented runtime system routine at a given source location at the source file name, function, and line level.
To use TAU, the user launches the application using the tau_exec tool with command optional parameters to enable various runtimes (for e.g. -l0 for the Level Zero instrumentation for Intel GPUs, -cupti for the CUDA Profiling Tools Interface, etc.) and generate profiles or traces as shown in Figure 1. While profiles show the aggregate statistics based on exclusive and inclusive durations and samples collected, traces offer a temporal view of the performance data typically along a timeline display where each process is shown along a time axis. After the experiment is concluded, TAU profiles can be viewed using pprof, or using the GUI, paraprof. TAU’s paraprof browser includes a 3D profile browser window where code regions, MPI ranks (and threads) and exclusive time spent in those code regions are all shown in a 3D plot that can be examined, as shown in Figure 2.
Uninstrumented execution
% mpirun -np 256  ./a.out
Track MPI performance
% mpirun -np 256  tau_exec ./a.out
Track GPU operations
% mpirun –np 256  tau_exec –rocm ./a.out
% mpirun –np 256  tau_exec –level_zero ./a.out
% mpirun –np 256  tau_exec –cupti ./a.out
% mpirun –np 256  tau_exec –opencl ./a.out
% mpirun –np 256  tau_exec –openacc ./a.out
Track I/O, and MPI performance (MPI enabled by default)
% mpirun -np 256  tau_exec -io  ./a.out
Track OpenMP and MPI execution (using OMPT for Intel v19+ or Clang 8+)
% export TAU_OMPT_SUPPORT_LEVEL=full;
% mpirun –np 256  tau_exec –T ompt,v5,mpi  -ompt  ./a.out
Use Event-based Sampling (EBS) with above options (compile with –g)
% mpirun –np 256 tau_exec –ebs [-ebs_resolution=<file|function|line>] ./a.out
Figure 1. Launching an application using tau_exec to generate performance data
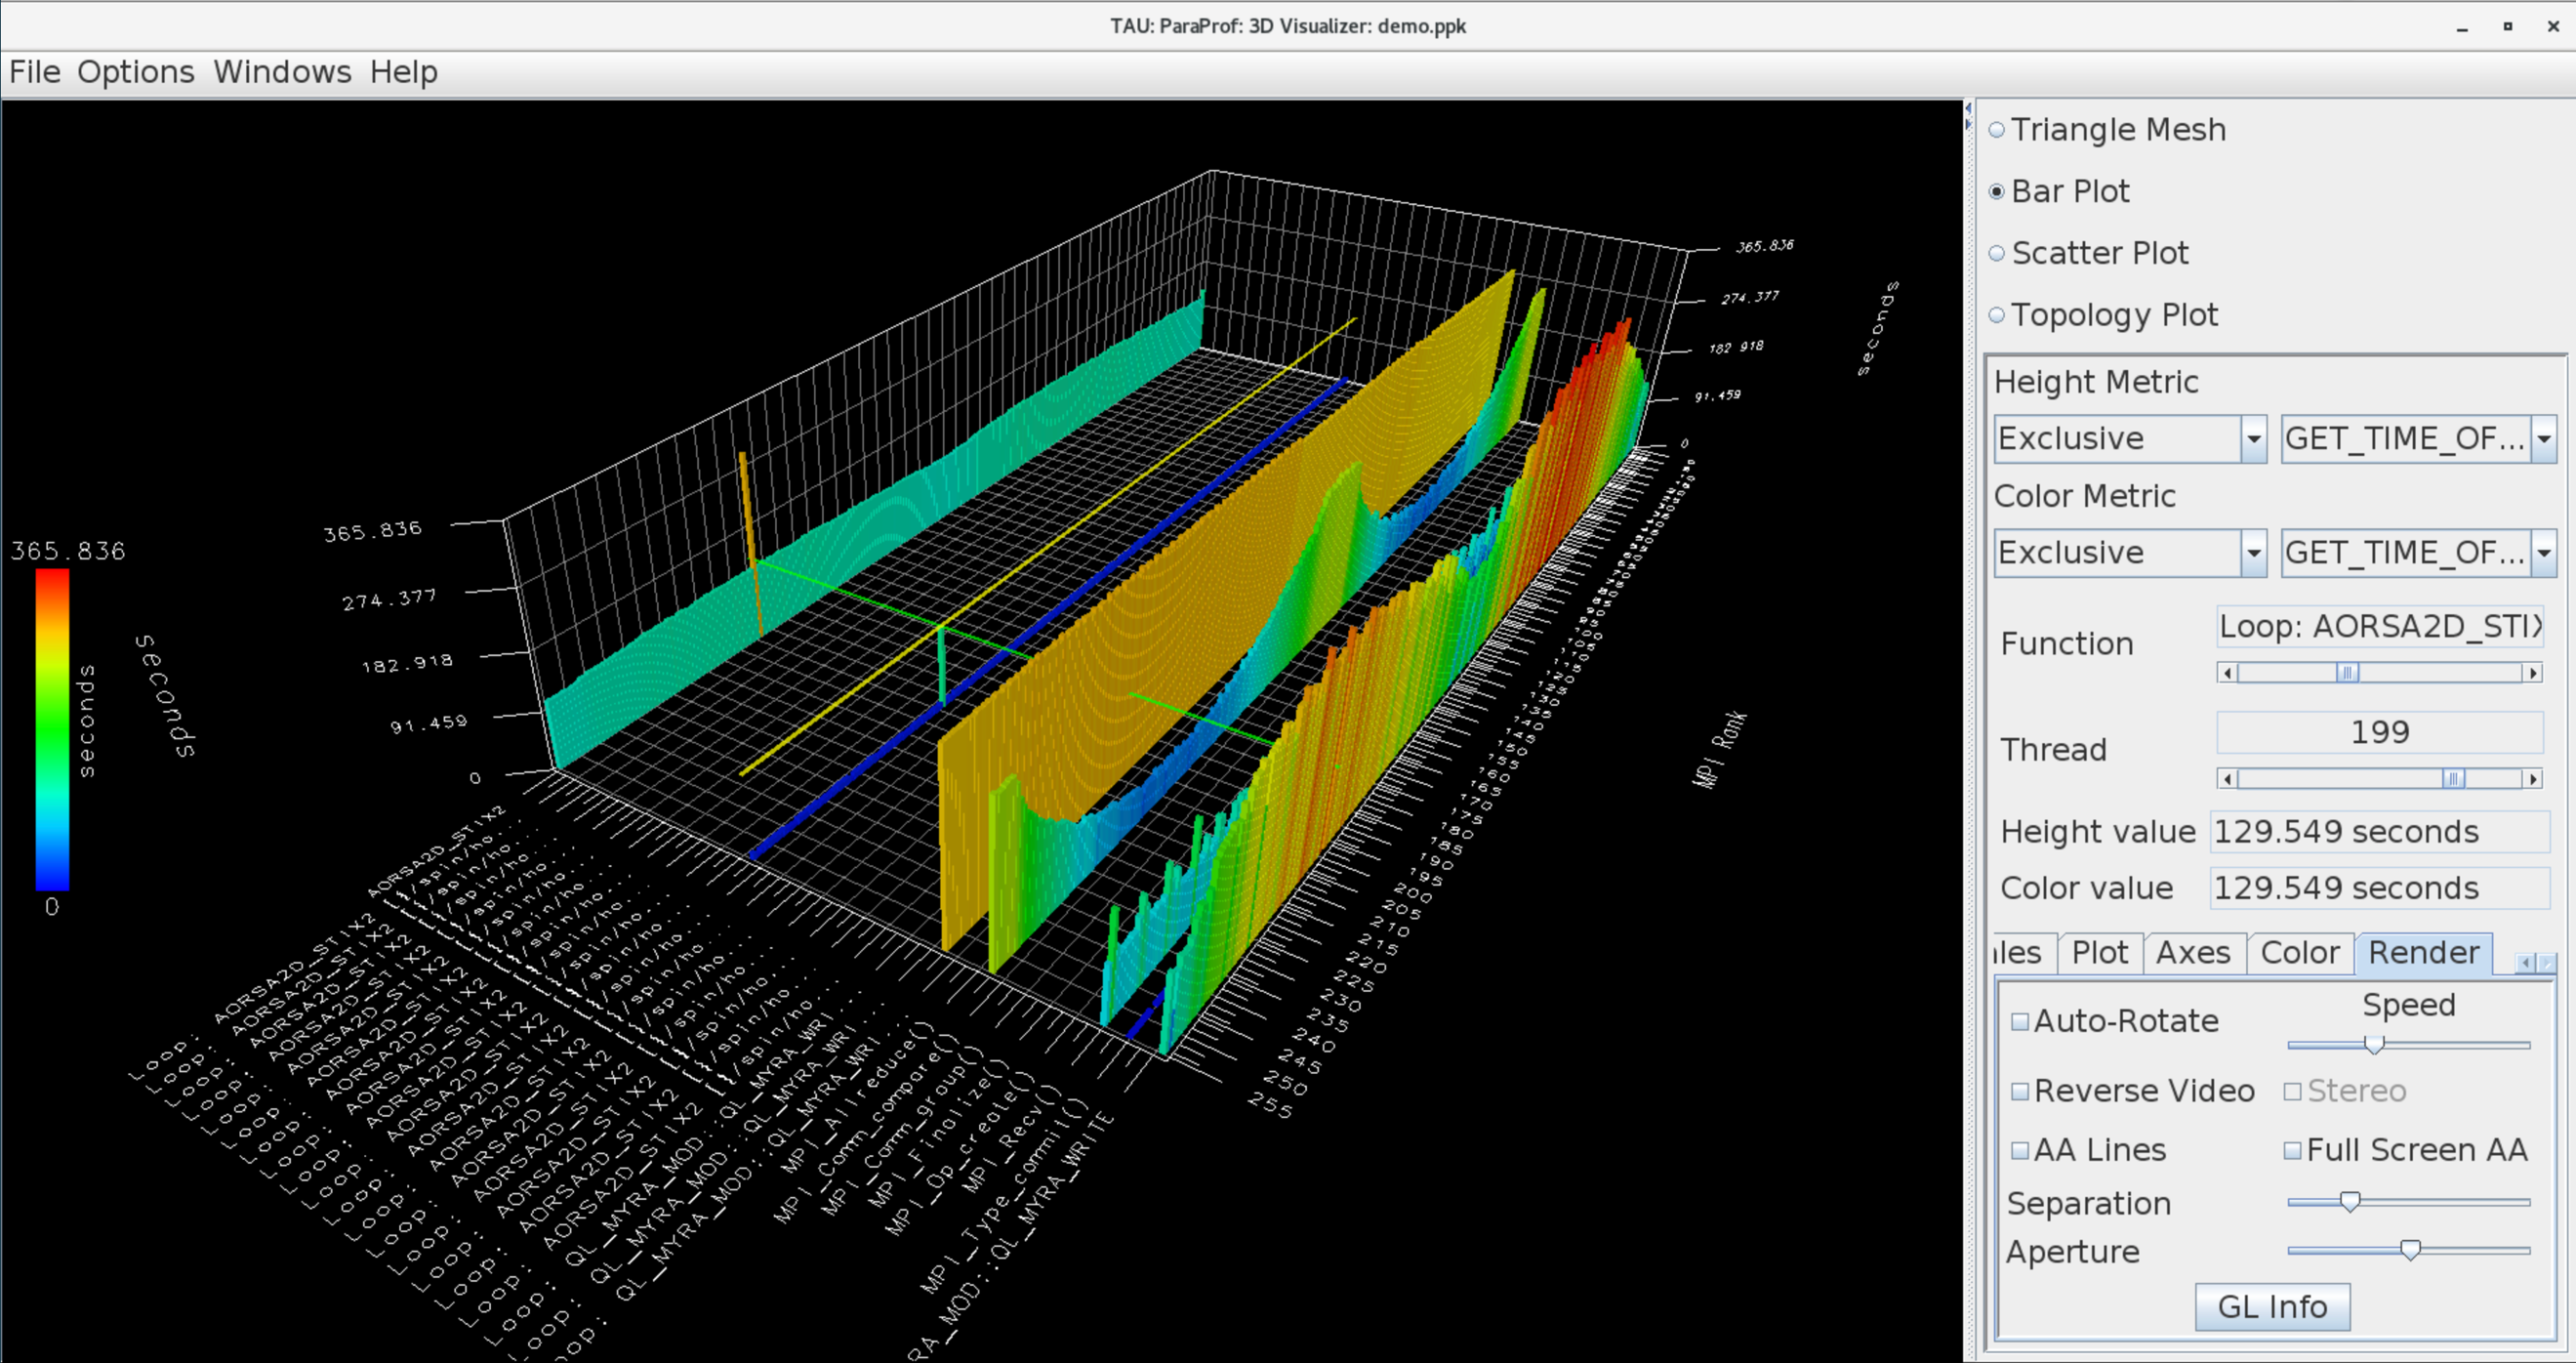
Figure 2. TAU’s 3D profile browser shows the shape of the application profile
Instrumentation
Event-based sampling (EBS) coupled with instrumentation of runtime system library calls provides a powerful mechanism for exposing performance details in a hierarchical manner. Consider an application using Kokkos to express parallelism using C++ lambda functions at the node level. Kokkos can use a variety of backends such as CUDA, pthread, or OpenMP to translate that parallelism into kernels that are executed within a node. Kokkos provides a powerful solution for the X in the widely discussed MPI+X problem with a performance portable solution that can be optimized using modern C++ compilers. Figure 3 shows a source code listing that illustrates Kokkos region and parallel for constructs in the ExaMiniMD application.
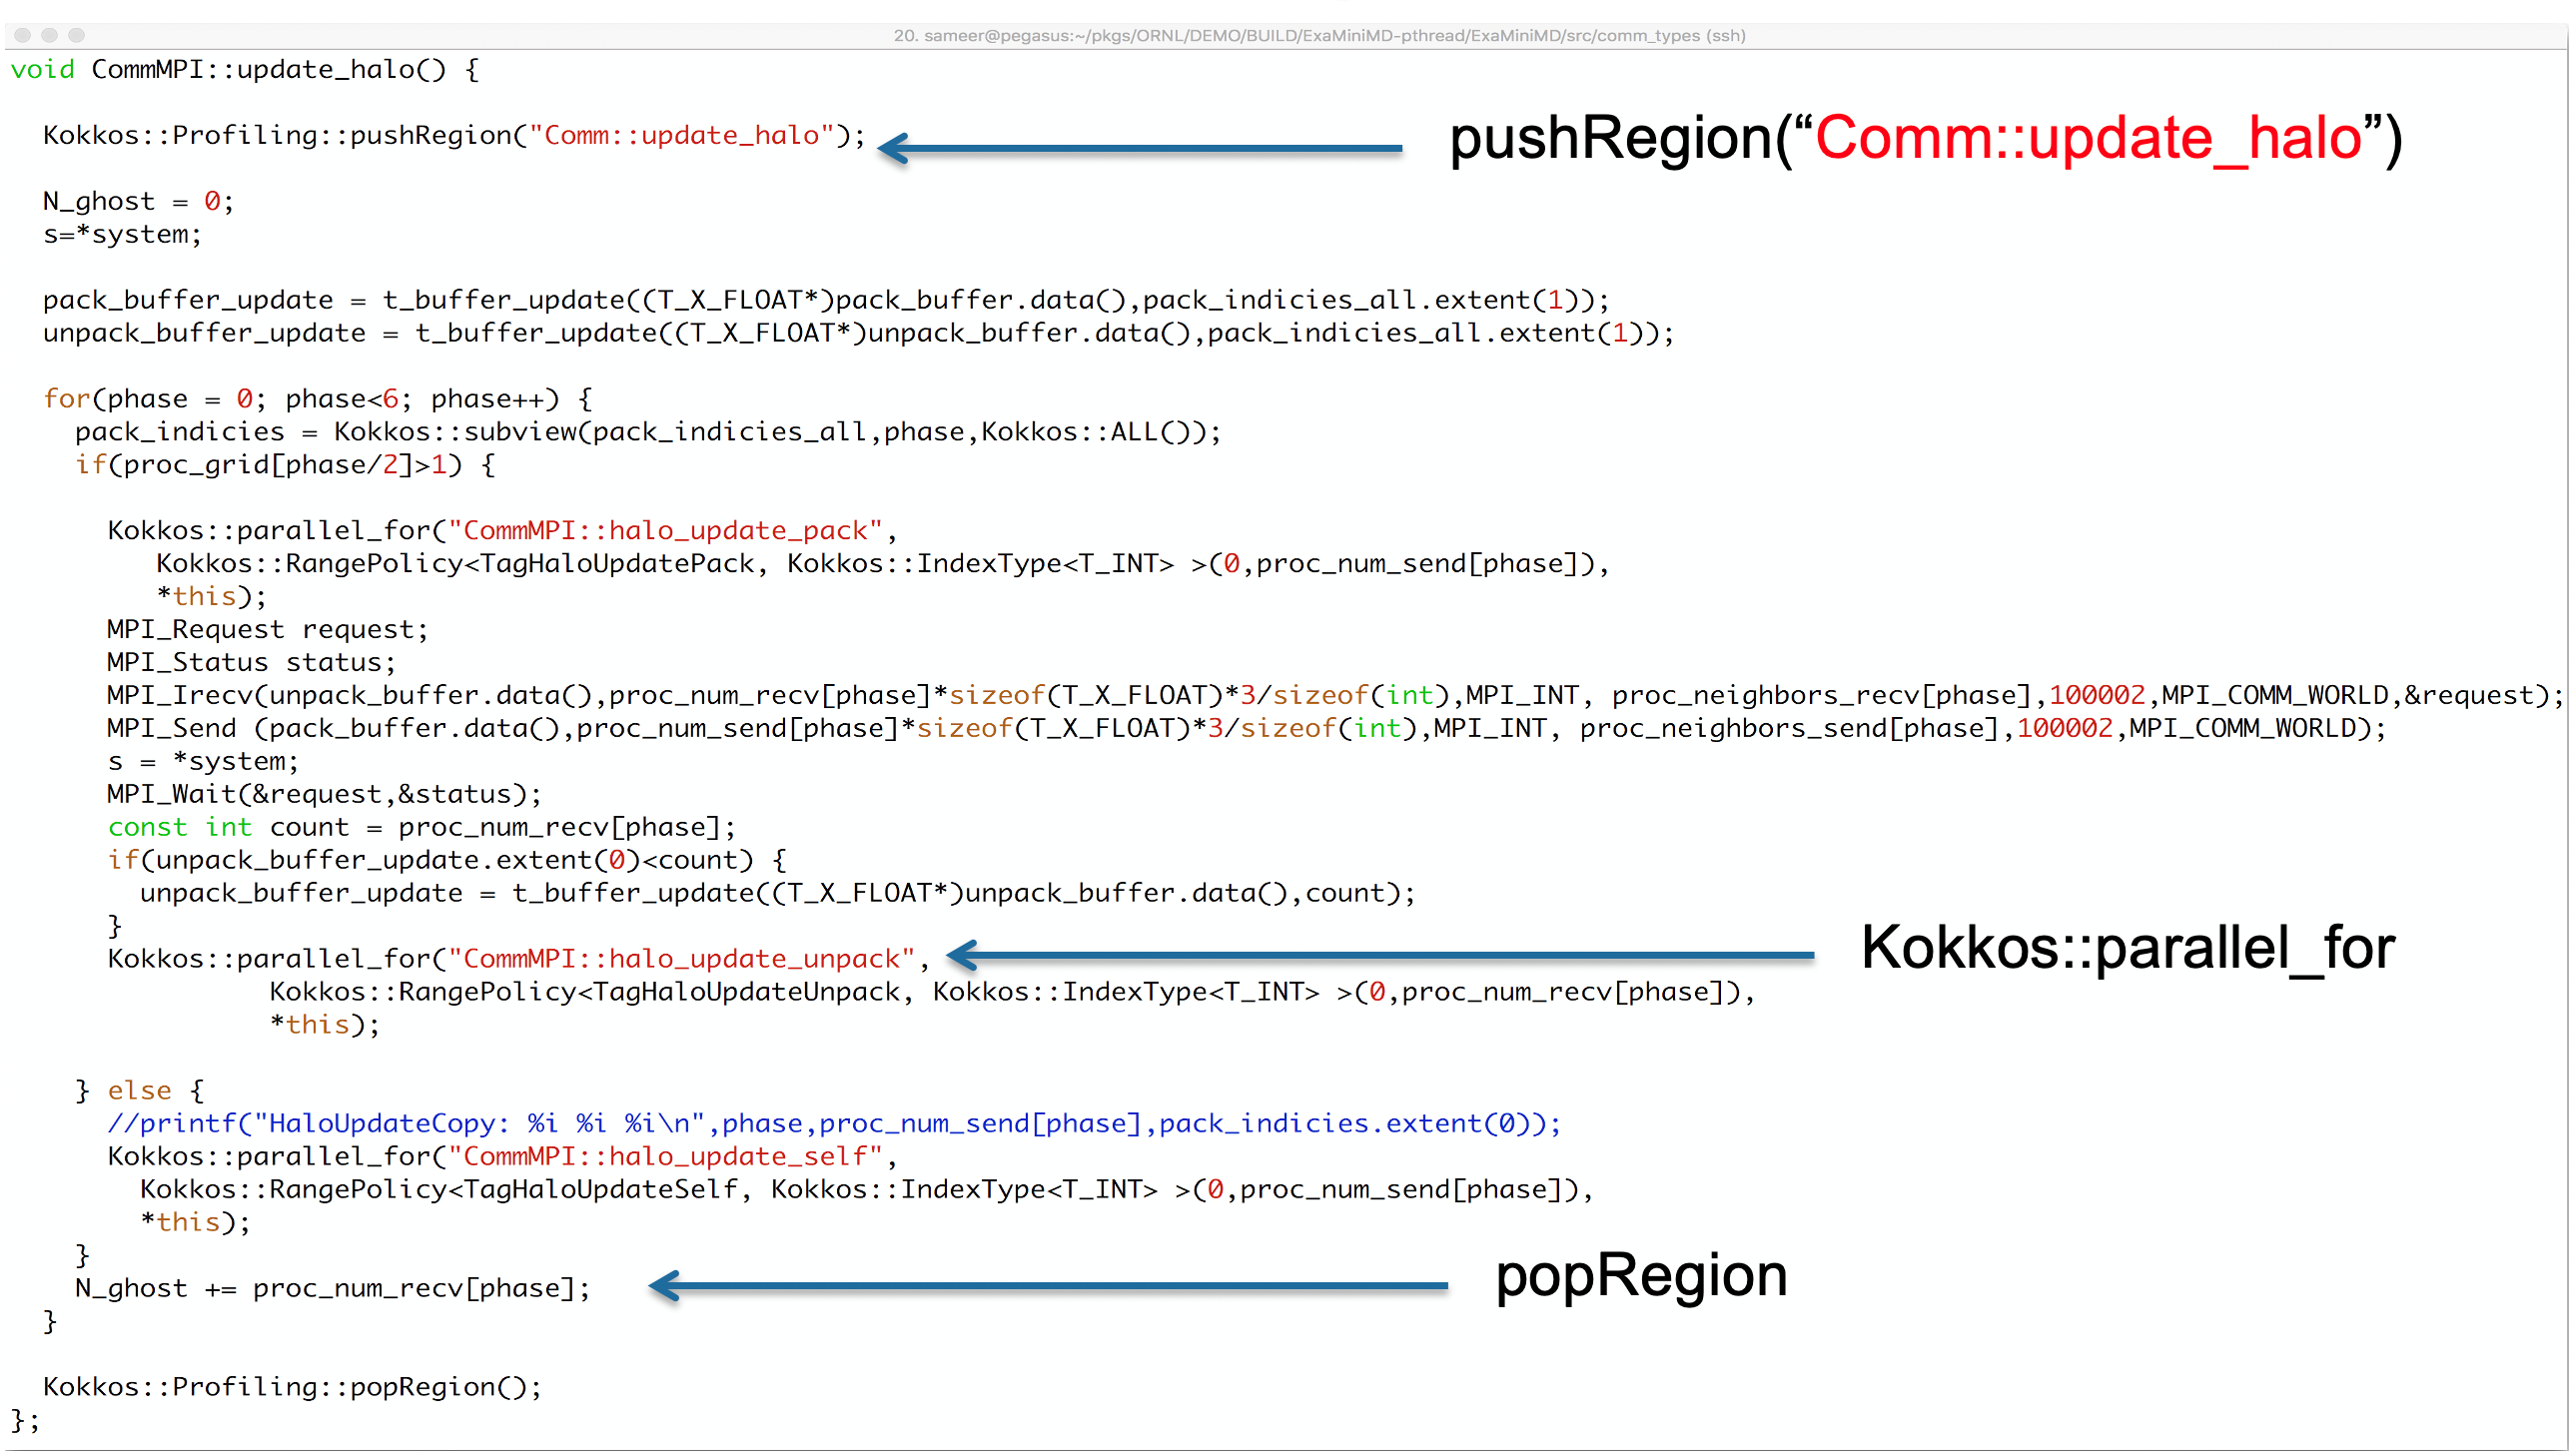
Figure 3. Kokkos calls in the ExaMiniMD application
Figure 4 shows how TAU can translate Kokkos region descriptions into phases in TAU [1]. ParaProf shows layers of the runtime including Kokkos, samples within the phases, and CUDA calls using the CUPTI interface, along with MPI calls.
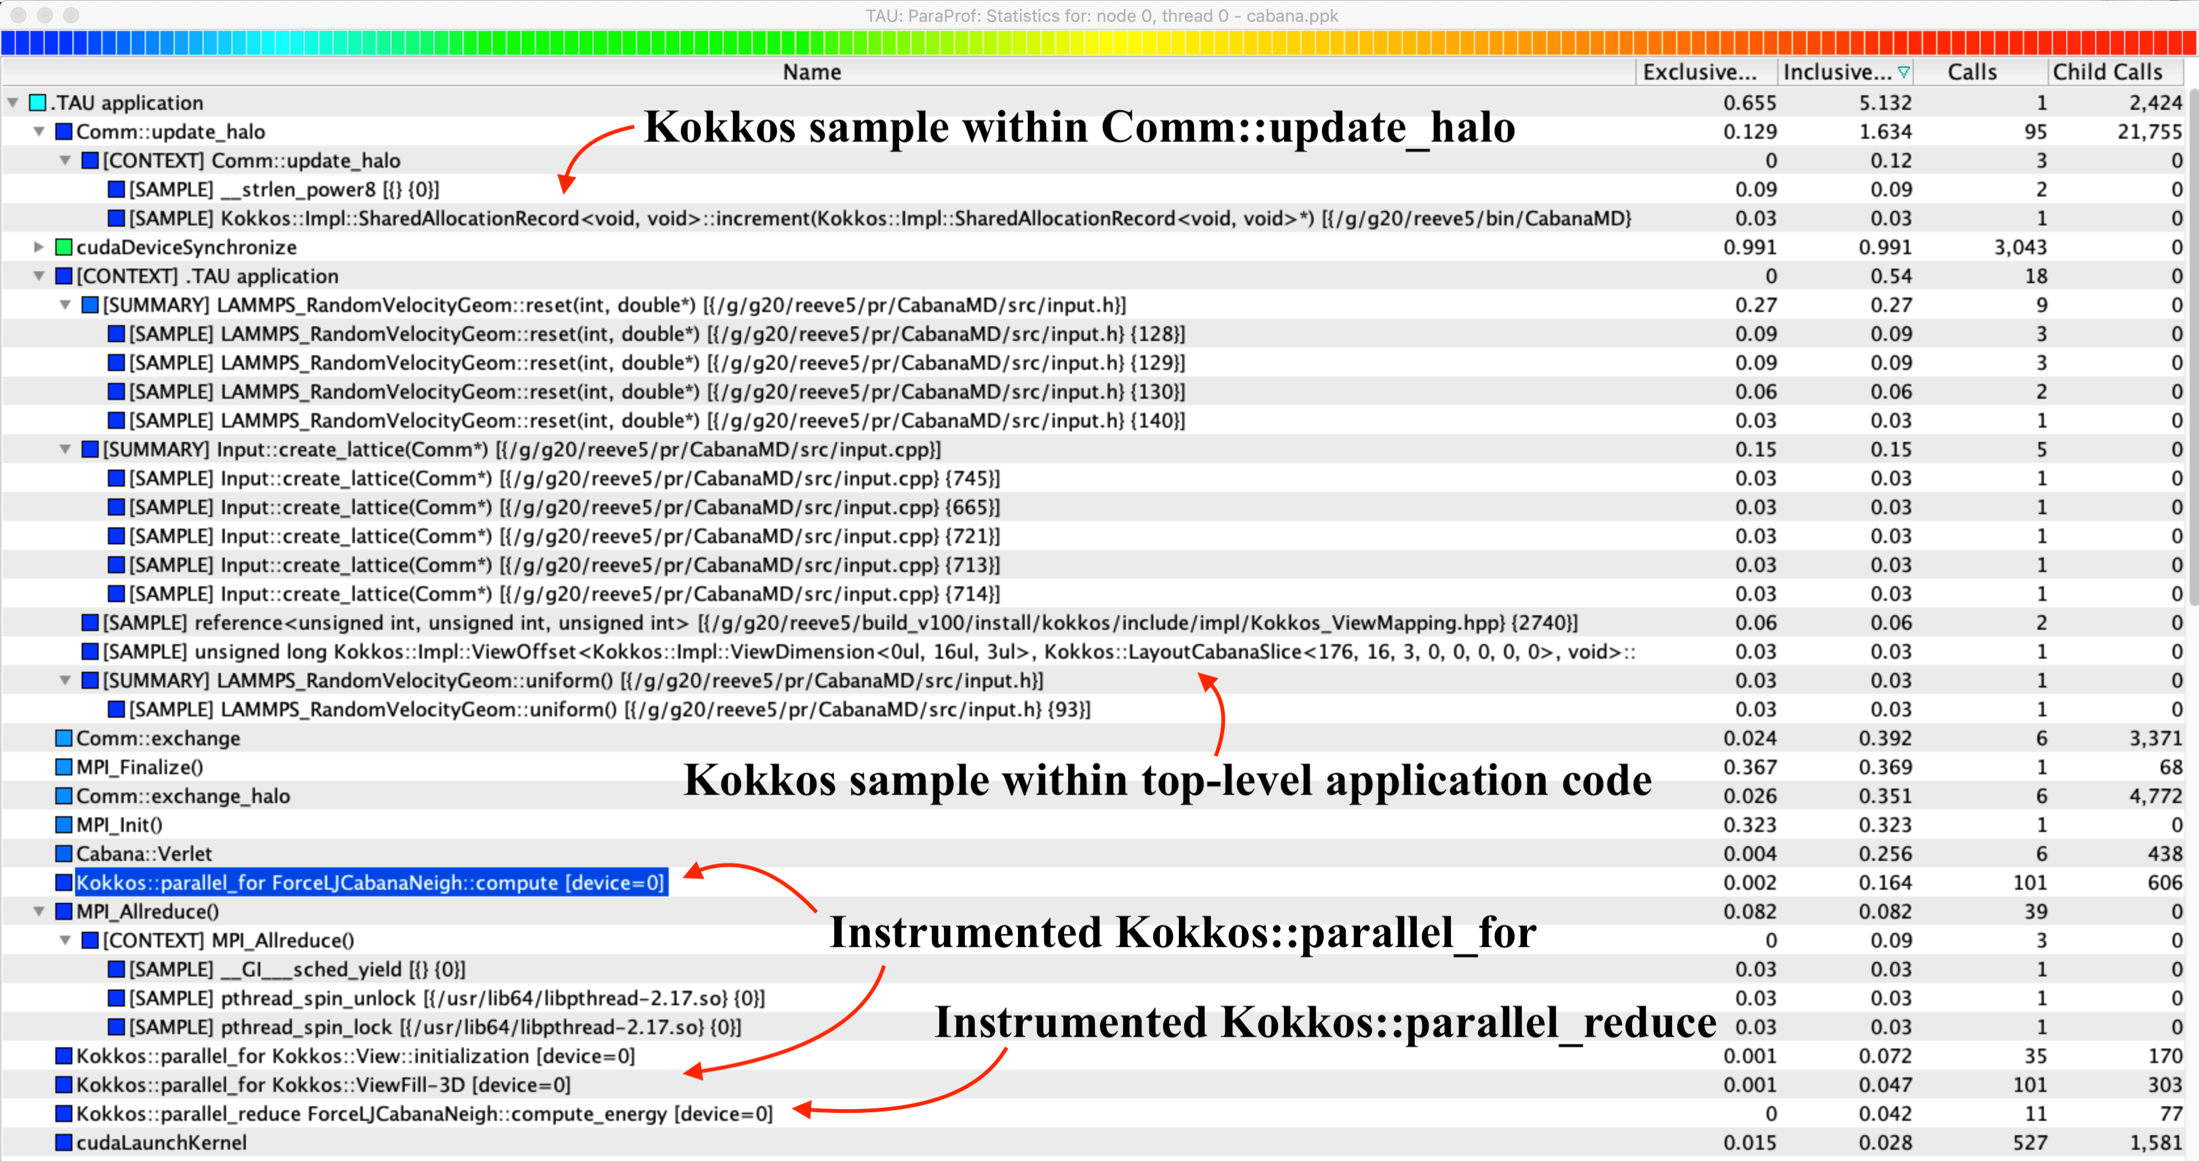
Figure 4. TAU’s ParaProf shows samples, Kokkos runtime functions, MPI, and CUDA calls.
TAU can also generate OTF2 traces natively, or it can use Score-P [2] measurement library to generate trace files. These files can be visualized in the Vampir trace visualization tool (Figure 5) from TU Dresden [3]. This provides a powerful mechanism to generate low-level trace data of kernel execution along a timeline for the application. Kernel names described in the first argument to Kokkos calls propagate through the Kokkos profiling interface through TAU to OTF2 traces. Other runtime events from OpenMP are also shown in the figure using OMPT instrumentation. What is interesting is that in each of these cases, TAU is able to generate this profile and trace data without modifying the application binary in any way.
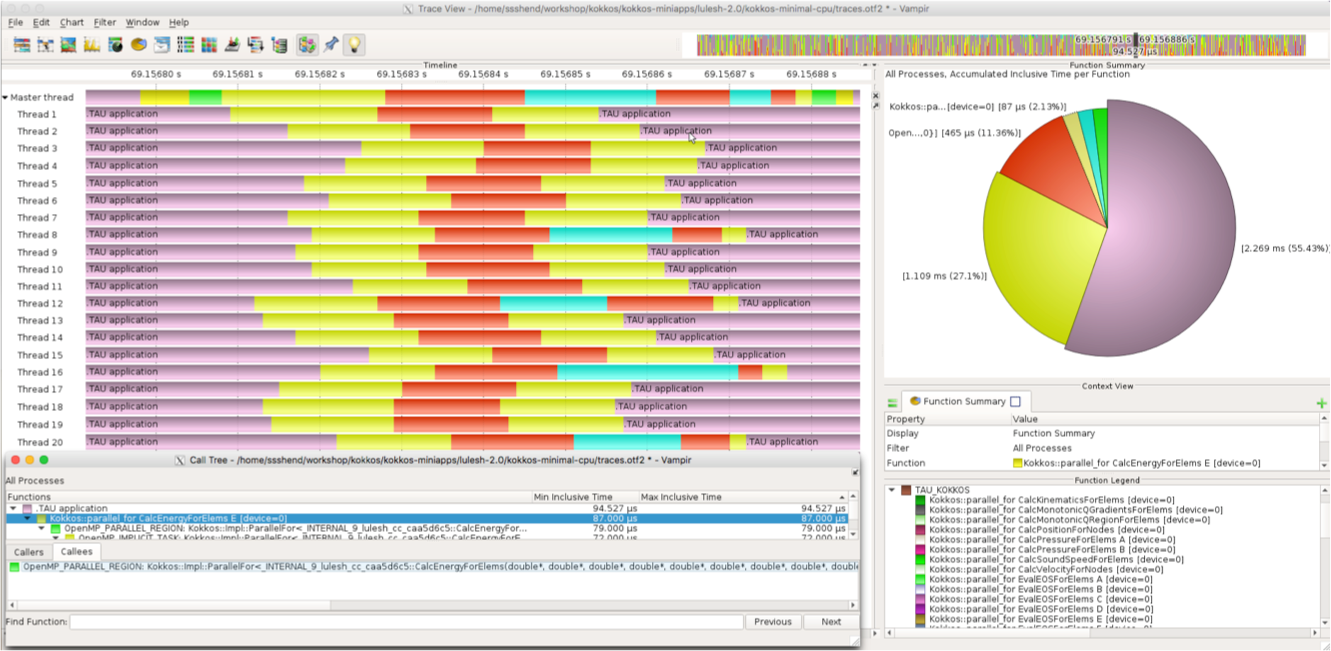
Figure 5. Vampir shows the Kokkos and OpenMP runtime performance data mapped back to source constructs specified by the user
Conclusion
Performance evaluation tools that can expose the inner workings of the runtime system and slice through layers of the runtime while sampling the rest of the application codebase provides a hybrid view of performance data. TAU has been extended recently to work with vendor-specific GPU runtimes such as Level Zero, ROCm, and CUPTI, as well as portable runtimes such as OpenACC, Kokkos, OpenMP, and MPI. Besides the GPU systems, TAU has also been ported to the Fugaku A64FX system with support for Fujitsu and ARM compilers, to Cray systems with A64FX and Intel processors, and to IBM Power 9 systems. On all these systems, TAU can generate both profiles as well as traces and can help shed light on the application bottlenecks with powerful performance data visualization tools. Given that it needs no modifications to the application binary, it is an easy tool to deploy while investigating application performance.
-- Sameer Shende (University of Oregon)
References
[1] S. Shende, N. Chaimov, A. Malony, N. Imam, “Multi-Level Performance Instrumentation for Kokkos Applications Using TAU,” ProTools 2019 Workshop at SC19. DOI: 10.1109/ProTools49597.2019.00012.
[2] Score-P: http://www.score-p.org
[3] Vampir: https://pop-coe.eu/blog/tool-time-performance-analysis-study-with-vampir