In the previous blog article POP tool descriptions: JSC performance tools, we gave a short overview of one of the JSC performance tools, the Scalasca Trace Analyser. Here we give a short introduction to Cube, another JSC performance tool in the Scalasca context with a particular focus on the CubeGUI.
The above mentioned Scalasca trace analysis tool, as well as the performance measurement tool “Score-P”, store their results in the Cube format. Originally being a part of the Scalasca v1 toolset, Cube has evolved into a standalone performance analysis tool set with rich analysis capabilities.
In its latest form Cube consist of four components, with various tasks and usage models. There is a specialized jCubeR library in native Java, used primarily by TAU. There is a high performance CubeW writing library, used by Score-P and Scalasca to create the measurement and analysis results. Additionally, there is a general purpose CubeLib library, which provides an interface for the manipulation of Cube profiles.
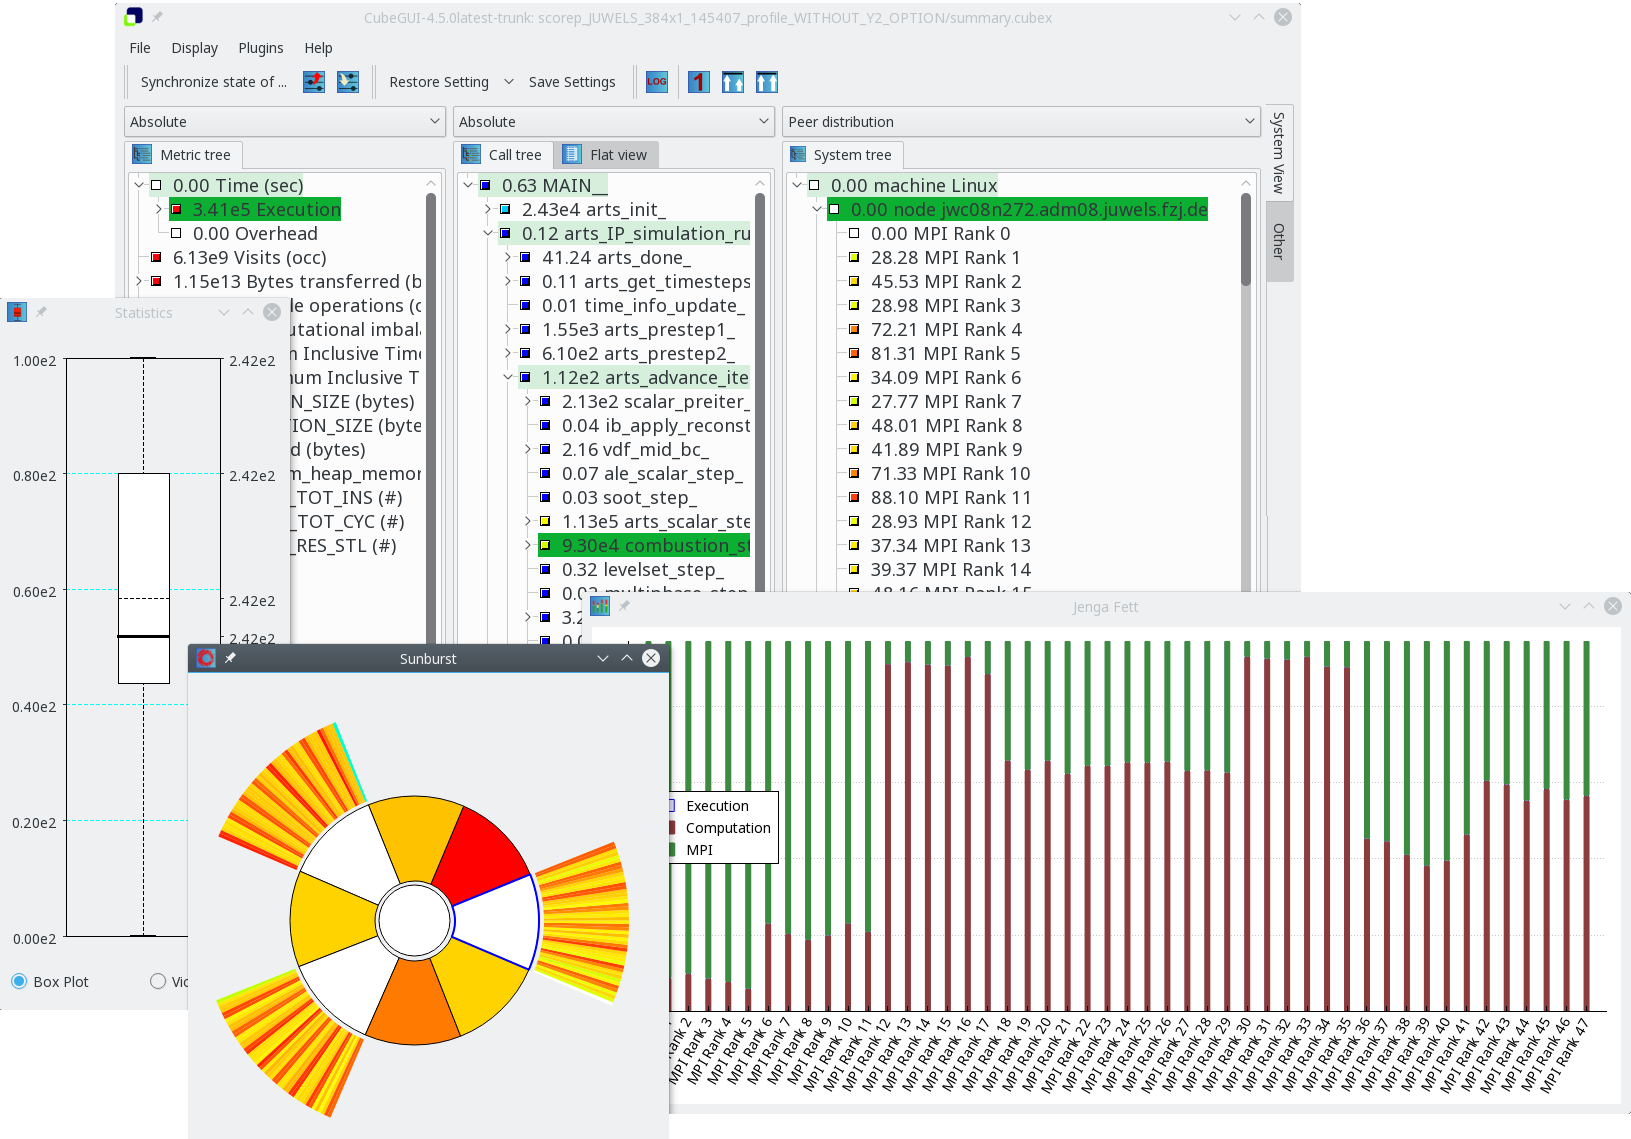
Figure 1: CubeGUI display with various plugins (System statistics, Sunburst, JengaFett)
CubeGUI is the graphical component of the Cube Tools collection for manual and semiautomatic performance exploration and provides various ways to analyze the performance data. In Figure 1 one can see an example of such a visualization.
CubeGUI has numerous features which allow users to analyze the performance measurements efficiently. An in depth reference of those features can be found in the Cube User Guide or the Cube Quick Start Guide. Moreover, there are various trainings organized by VI-HPS where users can learn how to use the CubeGUI most effectively. Downloadable from scalasca.org, the current official release is 4.4.4, the release preview is 4.5-RP.
The core functionality of the CubeGUI is the exploration and aggregation of the performance data along different dimensions, performance metrics, call tree locations, and system locations This allows the user to get a deep insight into the performance issues of an application. But the main feature of CubeGUI is the plugin architecture, which enables a rich spectrum of the performance analysis tools.
CubeGUI provides a series of the plugins, which allows the user to perform various analyses. User can explore synchronously the call tree of the application and the source code of it using the standard plugin “Source Code Viewer”. A user can create sophisticated derived metrics using the standard plugin “Metric Editor”. Users can connect a specific Call path or Metric with an external script via plugin “Launch”. The system tree can also be displayed as a “Sunburst” visualization. Loop iterations and their behavior can be studied using plugins like “Barplot” and “Heatmap”. More information on these and plenty more can be found online..
Moreover, in case the set of standard plugins is not sufficient for the performance analysis requirements, a user might develop an own plugin, using the CubeGUI Plugin API. JSC provides some experimental plugins in form of such third-party plugins.
There is a simple OTF2 Trace explorer called “Blade”, a metric correlations plugin “JengaFett”, a filter creation plugin “ScorePion”, as well as a call graph explorer “CallGraph”.
In context of POP it provides the plugin “Advisor” which allows fast access to POP metrics for the Score-P (summary.cubex) and Scalasca (trace.cubex) measurements and analysis results (see this blog article for more details).