The Jülich Supercomputing Centre develops Scalasca and associated tools for scalable performance analysis of large-scale parallel applications that are deployed on most of the largest HPC systems including Blue Gene/Q, Cray, Fujitsu, K Computer, Stampede (Intel Xeon Phi), Tianhe, Titan and others. The Score-P instrumentation and measurement infrastructure, developed by a community including RWTH Aachen University, supports runtime summarisation and event trace collection for applications written in C, C++ and Fortran using MPI, OpenMP, Pthreads, SHMEM, CUDA and OpenCL. For scalability, event traces are analysed via a parallel replay with the same number of processes and threads as the measurement collection, generally re-using the same hardware resources. This has facilitated performance analyses of parallel application executions with more than one million MPI processes and over 1.8 million OpenMP threads.
Scalasca trace analysis characterises parallel execution inefficiencies beyond those captured by call-path profiles. It detects wait states in communications and synchronisations, such as the "Late Sender" where receive operations are blocked waiting for associated sends to be initiated, and the root cause of these, such as excess computation or imbalance. Also contributions to the critical path of execution are quantified to highlight call-paths that are the best candidates for optimisation.

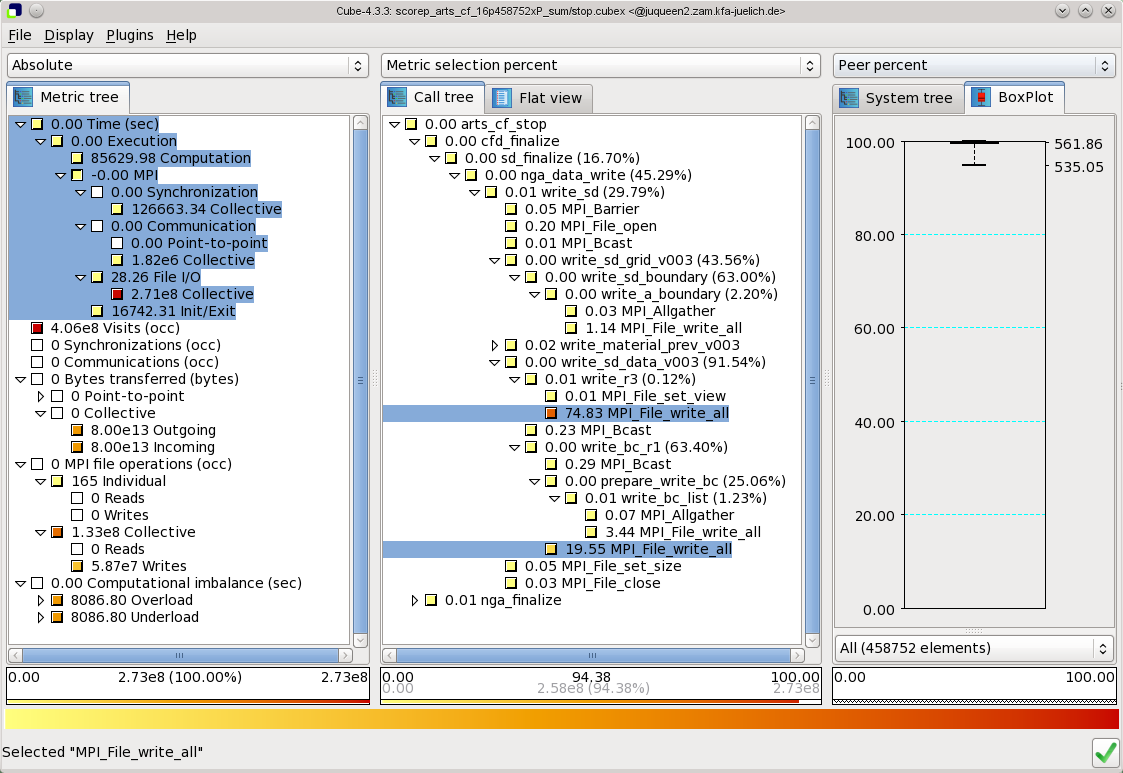
Scalasca and Score-P quantify metric severities for each call-path and process/thread, storing them in analysis reports for examination with the Cube GUI (see above) or additional processing via a variety of Cube utilities.
Additional wait-state instance statistics can be used to direct Paraver or Vampir trace visualisation tools to show and examine the severest instances.
The performance tools from JSC are freely available as Open Source software. More information is available from the project website http://www.scalasca.org/ or via e-mail: scalasca@fz-juelich.de.
