The POP service uses the POP metrics (described in this article) to measure the performance of parallel applications. This is usually done manually, but this can be tedious and prone to error. However, the calculations of POP metrics can now be simplified using the Scalasca performance measurement tool suite. This feature is provided with the latest release preview of Cube (version 4.5.0) which includes the CubeW, CubeLib, CubeGUI and jCubeR components and can be downloaded from here. During installation, in the configure stage of all the components, you can pass the same root directory to the --prefix flag as all the components can reside in one place.
Prior to execution, a number of environment variables will need to set to capture the relevant PAPI metrics:
$ export SCOREP_METRIC_PAPI=PAPI_TOT_INS,PAPI_TOT_CYC
$ export SCOREP_ENABLE_PROFILING=true
$ export SCOREP_ENABLE_TRACING=true
The first variable will include the total instructions and CPU cycles PAPI counters during the measurement. The second and third variables enable both profiling and tracing which are required to calculate the POP metrics.
After instrumenting the application code with the scorep command, execute your code (bt.A.x in the example below) with the scan command prefixed:
$ scan mpirun -n 4 bin/bt.A.x
This will create a directory with the following naming scheme in the current working directory:
scorep_<application name>_<number of processes>_trace/
Within the above directory, there will be two relevant files:
- scout.cubex
- profile.cubex
The two files need to be merged into a single file which will allow Cube to calculate the POP metrics:
$ cube_merge -o pop_all.cubex profile.cubex scout.cubex
Then load the newly created Cube file:
$ cube pop_all.cubex
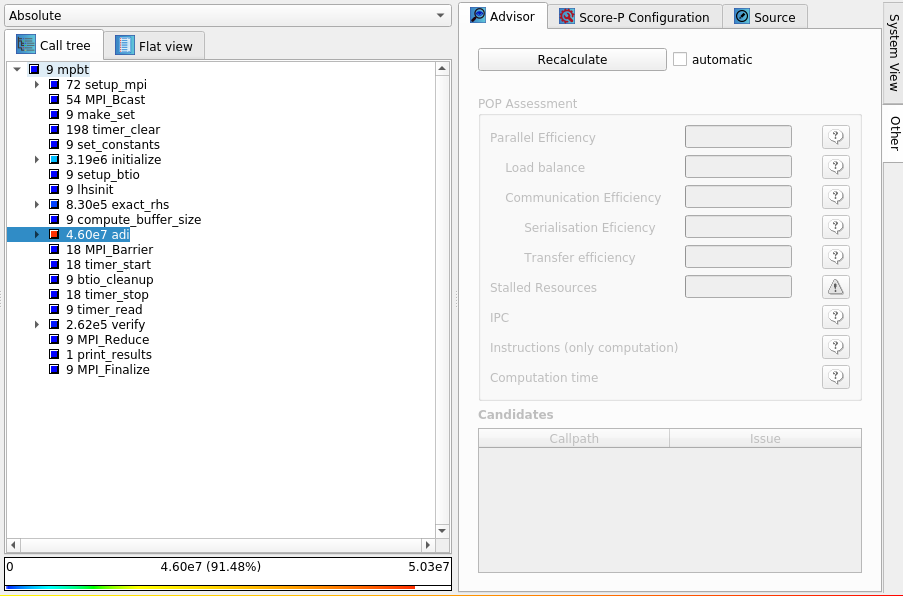
This should show something similar to the view below - to view the POP metrics, go to the System panel and click on the Other tab, and click on the Recalculate button. The POP metrics are independent of the metric selected. The POP metrics can be applied to certain subroutines in the call tree.
After clicking on the Recalculate button, this will then present the POP metrics, including the IPC (instructions per cycle), instructions and the computation time. The last three metrics can then be used to calculate the computational efficiencies.
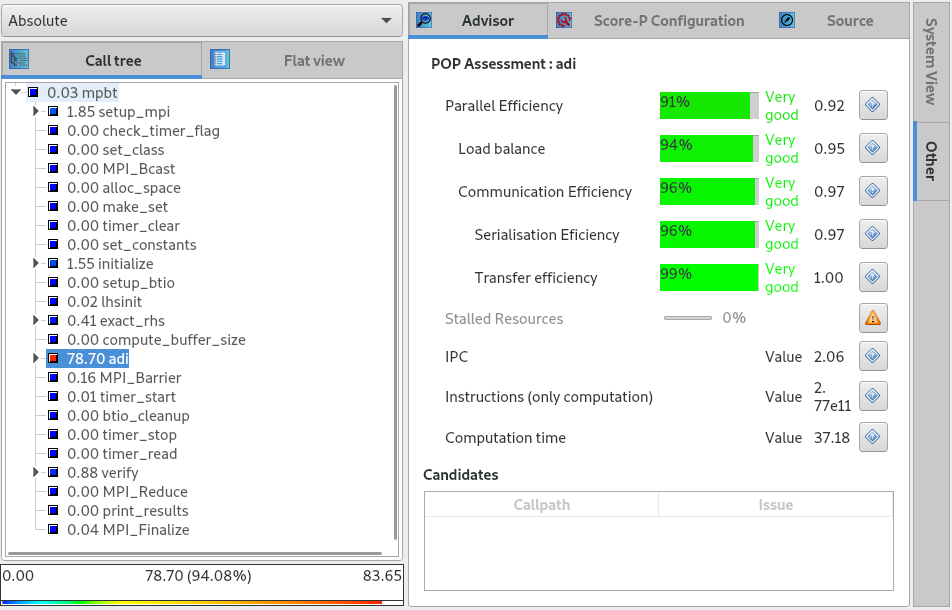
The POP metrics can also be calculated for a number of subroutines within the call stack by control clicking the subroutines of interest, and then clicking the Recalculate button.