Welcome to the 16th newsletter from the EU POP Centre of Excellence. Having now passed the midpoint of the project, we start by reflecting on past successes and looking forward to the future. We have exciting new technical blogs on the Caliper performance analysis toolbox and the Vampir profiling tool. This edition also covers how POP has improved the performance of computational engineering codes and will introduce the co-design work being carried out by POP.
This newsletter contains information on online learning, on performance profiling for HPC and details of an online workshop on performance profiling. The workshop will introduce the profiling tools and provide an opportunity to apply your newly acquired skills to benefit your own parallel code with practical hands-on support. There are also details of a webinar on profiling GPU codes by an expert from NVIDIA.
If you would like to contribute technical content for this newsletter on the topic of parallel performance profiling, please contact us at pop-helpdesk@bsc.es and we can review your request. We are always looking for novel technical content.
This issue includes:
- POP: Half Time Analysis;
- POP Webinar - Profiling GPU Applications with Nsight Systems – Thursday 24 September 2020, 14:00 BST | 15:00 CEST;
- Virtual VI-HPS Tuning Workshop – 14 to 18 September 2020
- Technical Blogs:
- Caliper - A Performance Analysis Toolbox in a Library;
- Performance Analysis Study with Vampir;
- POP Supporting Computational Engineering;
- Performance Profiling Online Training;
- Co-Design at POP;
- POP out and about – meet POP members face to face (with a mask) at the event:
- Teratec 2020 Forum. Ecole Polytechnique, Paris. October 13 - 14, 2020;
- The POP Helpdesk.
For past editions of the newsletter, see the POP newsletter web page.
POP: Half Time Analysis
Eighteen months ago, the POP Centre of Excellence started its second phase of funding (December 2018 to November 2021) so, having just passed the midpoint, perhaps now is a good time to reflect on the first half of this EU project and look forward to its future.
Read the blog here on what POP has achieved so far and its plans for the second half of the project.
POP webinar - Profiling GPU Applications with Nsight Systems
Thursday 24 September 2020 14:00 - 14:40 BST | 15:00 – 15:40 CEST
This talk will give an overview of NVIDIA's Nsight profiling tools and will explore how to analyze and optimize the performance of GPU-accelerated applications. Working with a real-world example, the webinar will start by identifying high-level bottlenecks, then walk through an analysis-driven process leading to a series of kernel-level optimizations.
About the presenter
Mozhgan Kabiri Chimeh is a GPU developer advocate at NVIDIA, helping to bring GPU and HPC to the growing user community in EMEA and around the world. She is a community builder with a passion for open source software and is actively involved in the HPC and RSE communities. As a Software Sustainability Institute fellow, and Research Software Engineer (RSE) advocate, she is actively promoting reproducible and sustainable software, use of HPC and particularly GPUs through training, seminars, research software consultancy and outreach.
She is actively involved in outreach programmes to encourage and empower minorities involvement at all levels within the HPC sector and is a long-standing Women in HPC volunteer, including leading WHPC’s workshop last year and this year at International Supercomputing Conference. Mozhgan holds a Ph.D. in computer science and a master's degree in Information Technology from the University of Glasgow, UK.
Click on this link for registration.
VI-HPS Tuning Workshop
Monday 14th September – Friday 18th September 2020 | Online using Zoom
This workshop, organised by VI-HPS and HLRS as a PRACE training event, will give an overview of the VI-HPS programming tools suite. The workshop will explain the functionality of individual tools, how to use them effectively and will offer hands-on experience and expert assistance using the tools.
The topics and tools covered are:
- TAU performance system;
- MAQAO performance analysis and optimisation;
- Score-P instrumentation and measurement;
- Scalasca automated trace analysis;
- Vampir interactive trace analysis;
- Paraver/Extrae/Dimemas trace analysis and performance prediction;
- Hands-on assistance on using the tools on your own parallel code.
For more information and registration for this workshop, please click here.
Technical Blogs
We have two new blogs related to performance profiling tools.
Caliper - A Performance Analysis Toolbox in a Library
Caliper is a performance analysis toolbox in a library. Unlike many traditional performance analysis tools that focus on interactive in-depth performance debugging, Caliper directly integrates performance profiling capabilities into HPC applications, making them available on-demand for any application run. This approach greatly simplifies performance profiling tasks for application end-users, who can enable performance measurements for regular program runs without the complex setup steps often required by specialized performance debugging tools.
Click here to read the article.
Performance Analysis Study with Vampir
Vampir suite has been successfully applied to identify performance bottlenecks and assist in their correction. This article illustrates one optimization process to show in which ways the provided toolset can be used to find performance problems in program code. The example demonstrates a three-part optimization of a weather forecast model with added simulation of cloud microphysics.
Click here to read the article.
POP Supporting Computational Engineering
Many sectors have benefited from the POP service and one example of where great gains have been achieved is computational engineering. Simulation is widely used in engineering workflows and particularly during prototyping of products. Time to solution is critical, hence the need for faster simulations. Here we look at three examples from this sector, where POP helped boost code performance.
POP achieves three times speed up in Computational Fluid Dynamics code
POP worked with Zenotech on their computational fluid dynamics solver zCFD. The software is written in Python and C++.
 As a result of a POP Proof-of-Concept study, the code ran 3x faster for the large test case. This was achieved by:
- Parallelising serial portions of code, specifically those which were not already running in parallel because of a compiler problem;
- Improving computational load balance across OpenMP threads by avoiding very slow mathematical function calls;
- Changing execution environment settings to boost CPU performance.
Click here to read more about the zCFD assessment.
POP Proof-of-Concept study leads to 10X performance improvement for metallurgy code
The Institute of Physical Metallurgy and Metal Physics at RWTH Aachen University develops a code for the simulation of microstructure evolution in polycrystalline materials, called GraGLeS2D. After a POP performance assessment, several issues were detected and the implementation of the recommendations in a proof-of-concept led to a 10x increase in performance over the region of interest. The optimisations included:
- The use of a memory allocation library optimized for multi-threading.
- Reordering the work distribution to threads in comparison to optimize for data locality between neighbouring cells. (see Figure below)
- Algorithmic optimisations in the convolution algorithm.
- Code restructuring to enable vectorization in parts of the computation.
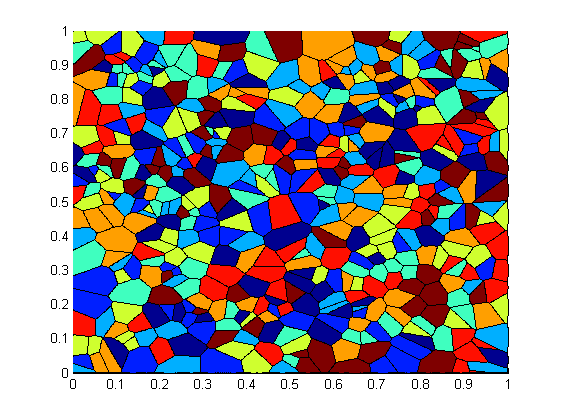
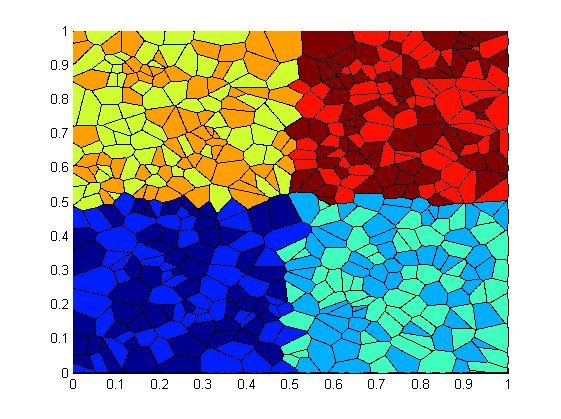
Initial work/data distribution over sockets (left) compared to the optimized distribution (right)
Click here to read more about the GraGLeS2D assessment.
POP Performance Study Improves Performance By Up To A Factor of 6
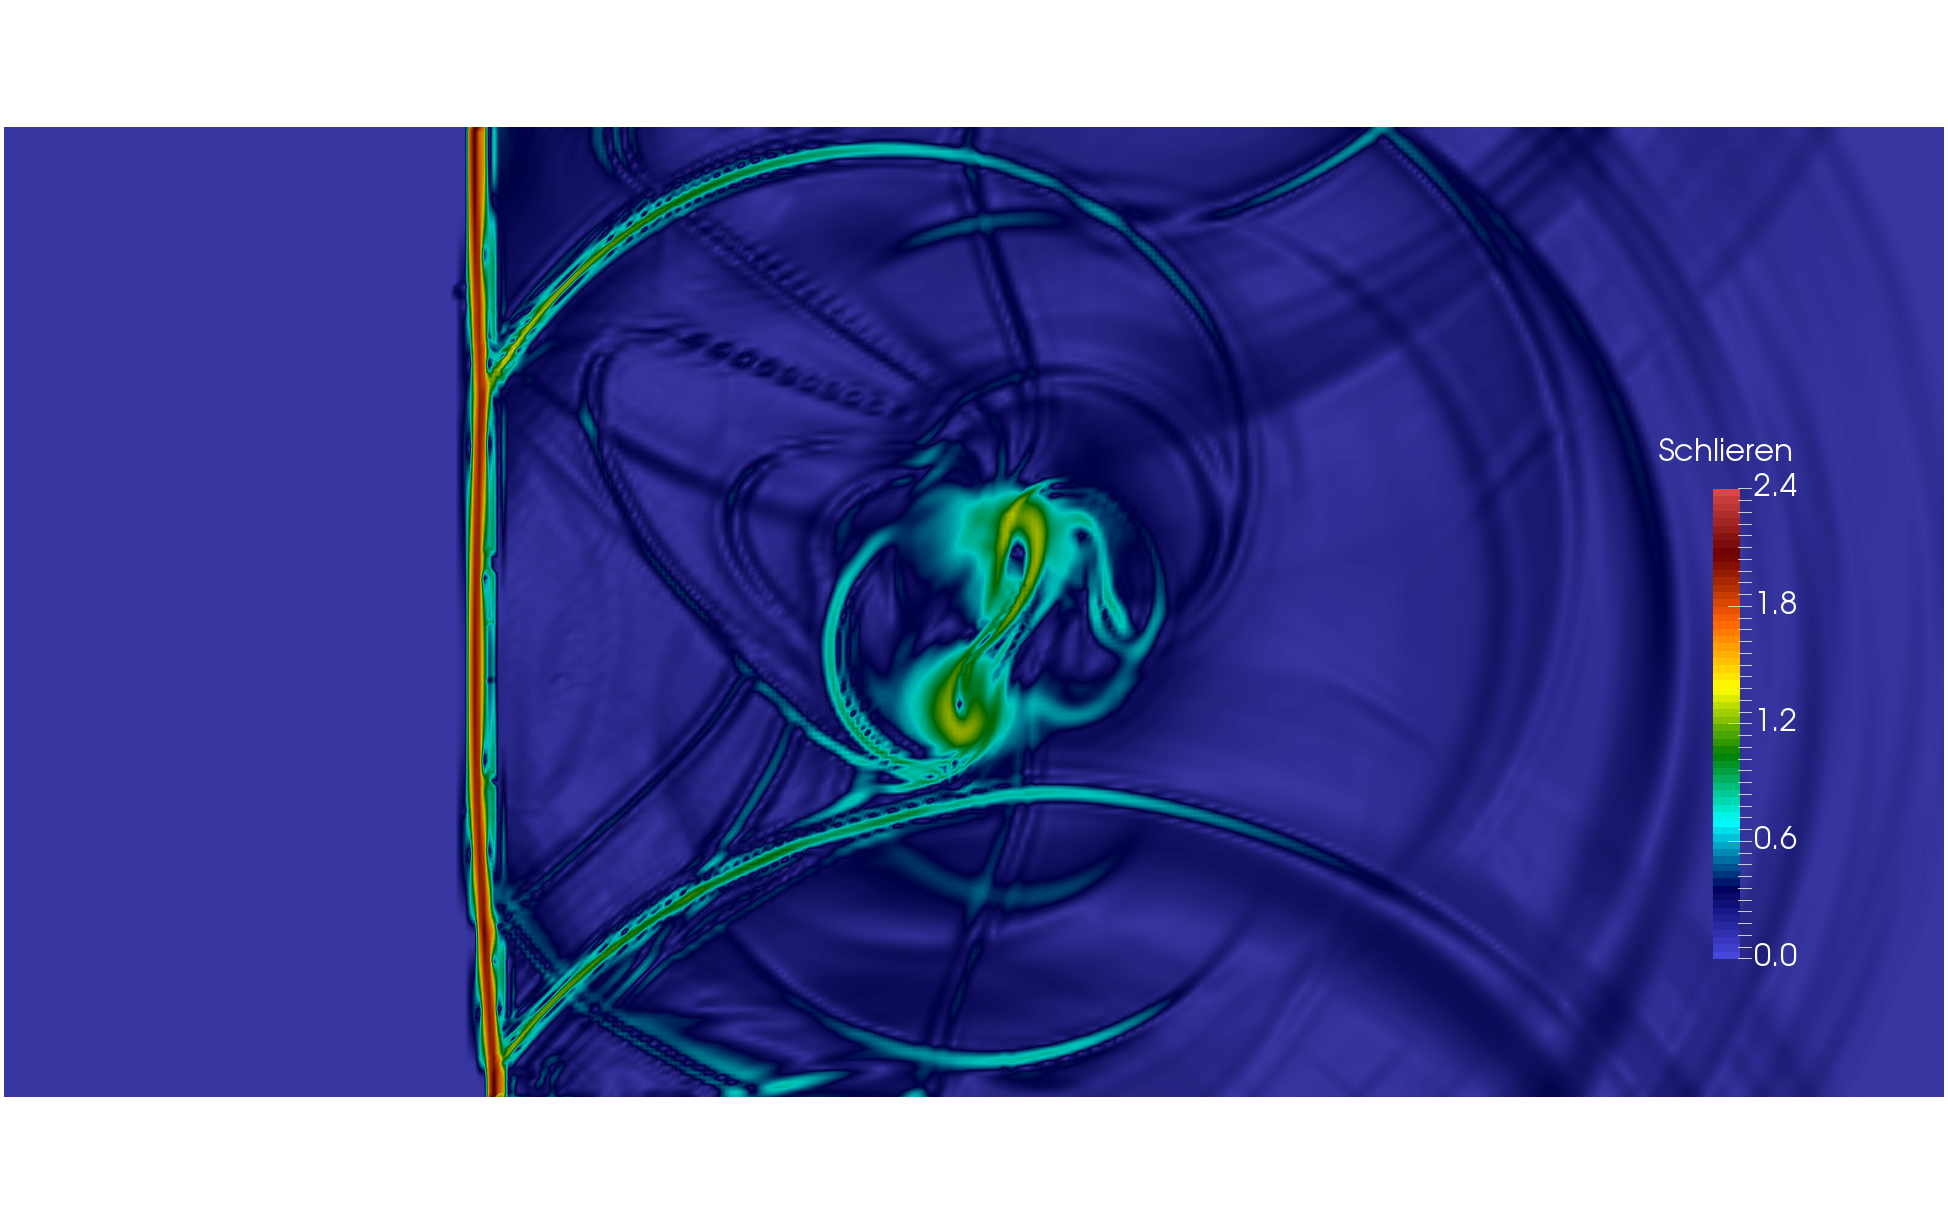
The computer animation department of the Stuttgart Media University, in cooperation with the Visualisation Research Centre of the University of Stuttgart, develops a Smoothed Particle Hydrodynamics solver to simulate fluids for computer graphics applications called sphFluids. The Code is written in C++ and was mainly developed as a cross-platform desktop application, which is parallelized with OpenMP.
 One of the issues found was code regions with low instruction per cycle (IPC) values. Several causes for this where pointed out including:
- Definitions of variables in inner loops
- Unnecessary operations caused by indirections in the code design
- Non-inlined functions
- Cache misses, due to memory calls
The developers came to the decision to completely rewrite the simulation code using the insights gained. This led to an overall performance improvement of up to 500% - 600%, depending on the scenario and pressure model used.
Click here to read more about the GraGLeS2D assessment
Performance Profiling Online Training
POP provides a set of short training videos on topics related to our methodology, such as explaining the metrics and how to install and use our tools. Each module has a video with accompanying presentation slides and some also contain simple example codes to help you get started quickly. Three of these modules are listed below.
- Our service uses the POP metrics to quantify various aspects of the performance of parallel applications and so help target optimisation efforts. Click here to learn more about these metrics.
- The Scalasca toolset is one of the tools used within the POP project to identify inefficiencies within parallel codes. Learn how to install the Scalasca toolset on your machine or HPC cluster here
- and how to use this toolset here.
Check out the current list of modules here – more topics will be added in due course. If you have any specific training needs on parallel performance profiling, feel free to get in touch with us at pop-helpdesk@bsc.es and one of our technical experts will contact you.
Co-Design at POP
POP are developing a co-design repository to support parallel code developers in writing efficient code. The contents of the repository is based on the sort of problems that we have encountered in codes during the POP project and the methods we use to improve them. Kernels have been developed which demonstrate patterns of poor performance that are often seen in HPC codes and the corresponding best practice which would perform much better. These kernels are classified according to programming language, parallel model (e.g. MPI and OpenMP) and academic discipline.
The co-design work is ongoing and many new kernels are under development. You can browse the repository here.
POP Out and About
Assuming it goes ahead, POP will be attending the following event. If you would like to meet a member of the POP team, please email pop-helpdesk@bsc.es and we will happily arrange a meeting with you.
TERATEC 2020 Forum | 13 – 14 October 2020
The TERATEC Forum is a major event in France that brings together international experts in HPC, simulation and big data. It welcomes more than 1,300 attendees, highlighting the technological and industrial dynamism of HPC and the essential role that France plays in this field.
For more information on the conference, please click here.
If you feel that POP should be attending an event that you think is relevant, please contact us at pop-helpdesk@bsc.es - suggestions are most welcome!
Apply For Free Help with Code Optimisation
We offer a range of free services designed to help EU organisations improve the performance of parallel software. If you are not getting the performance you need from parallel software or would like to review the performance of a parallel code, please apply for help via the short Service Request Form, or email us to discuss the service further and how it can be beneficial.
These services are funded by the European Union Horizon 2020 research and innovation programme so there is no direct cost to our users.
The POP Helpdesk
Past and present POP users are eligible to use our email helpdesk (pop-helpdesk@bsc.es). Please contact our team of experts for help analysing code changes, to discuss your next steps, and to ask questions about your parallel performance optimisation.