Caliper is a performance analysis toolbox in a library. Unlike many traditional performance analysis tools that focus on interactive in-depth performance debugging, Caliper directly integrates performance profiling capabilities into HPC applications, making them available on-demand for any application run. This approach greatly simplifies performance profiling tasks for application end users, who can enable performance measurements for regular program runs without the complex setup steps often required by specialized performance debugging tools. With Caliper, users control performance profiling through application-defined inputs, like a command-line argument. In the example below, the -P runtime-report command-line argument prints a time profile at the end of the program run:
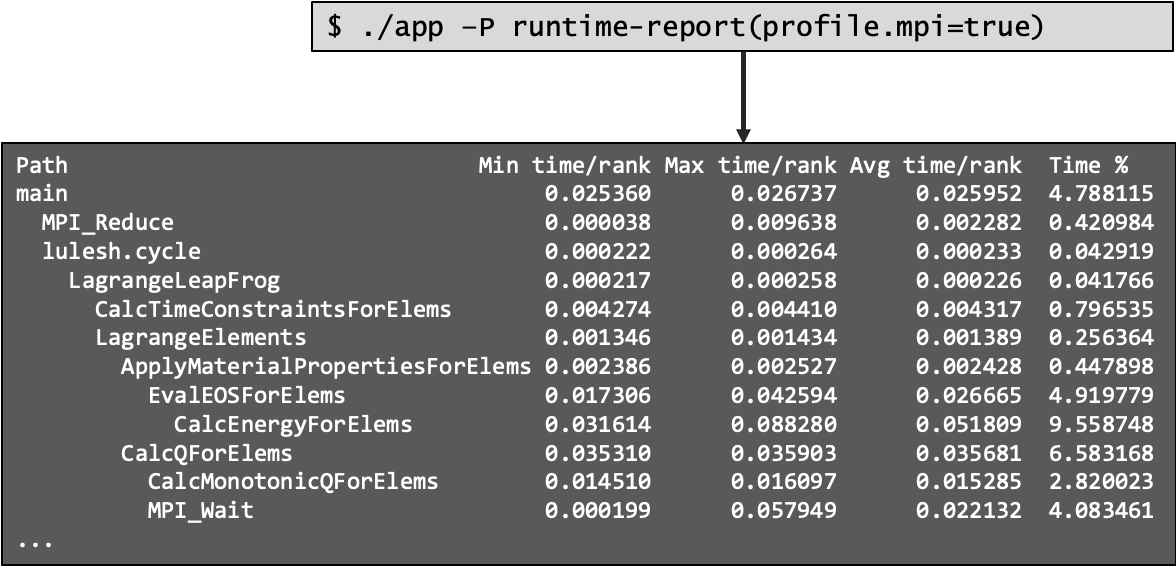
Figure 1: Performance profiling can be controlled through the application, e.g. via a command-line switch. The "runtime-report" configuration prints the time spent in instrumented regions
Usage
Caliper supports HPC programs in C, C++, and Fortran. To integrate Caliper, developers link it to their code, mark regions of interest with instrumentation annotations, and optionally use Caliper’s ConfigManager API to control performance profiling directly through the application.
Instrumentation
  #include <caliper/cali.h>

  void foo() {
      CALI_CXX_MARK_FUNCTION;

      CALI_MARK_BEGIN("myregion");
      // ...
      CALI_MARK_END("myregion");
  }

  int main()
  {
      CALI_CXX_MARK_LOOP_BEGIN(loop_id, "loop");
      for (int i = 0; i < 4; ++i) {
          CALI_CXX_MARK_LOOP_ITERATION(loop_id, i);
          foo();
      }
      CALI_CXX_MARK_LOOP_END(loop_id);
  }
|
Listing 1: Caliper source-code annotations
We primarily rely on manual source-code annotations for user-code instrumentation. Caliper
provides a variety of macros to mark functions, loops, loop iterations, and other code regions of interest. While adding the source-code annotations does require some initial effort, manual instrumentation offers distinct advantages for our use cases:
- Control: Developers can precisely control instrumentation granularity to limit instrumentation overhead and clutter.
- Interpretability: User-defined instrumentation describes logical program abstractions like kernels or phases that are meaningful to the developers. In contrast, automated approaches that rely on compiler-generated symbol names often generate obscure associations, in particular with modern C++ template codes.
- Consistency: We often want to compare performance data between different program versions. The logical program structure expressed in manually instrumented regions typically remains very stable, allowing meaningful performance comparisons over long time spans.
Once in place, the source-code annotations stay in the application code. Caliper annotations are accessible to other tools via callbacks and signal-safe query functions, and we provide adapters to forward Caliper annotations to third-party tools, such as TAU, Nvidia’s nvprof / NSight, Arm MAP, and Intel VTune.
Control API
In addition to the instrumentation API, Caliper offers the ConfigManager API that lets applications enable and control performance measurements. A ConfigManager object provides access to Caliper’s built-in performance measurement configurations. The add() method selects a measurement configuration with a short configuration string. This configuration string is typically provided by the user in some form, for example as a command-line parameter. The start() method starts performance profiling using the given configuration(s), and the flush() method writes out the recorded data.
  #include <caliper/cali.h>

  int main(int argc, char* argv[]) {
      MPI_Init(&argc, &argv);
      // ...
      cali::ConfigManager mgr;
      mgr.add(argv[1]);
      mgr.start();
      // ...
      mgr.flush();
      MPI_Finalize();
  }
|
Listing 2: The ConfigManager API accesses Caliper's built-in performance measurement configurations
Available ConfigManager configurations include the runtime-report and loop-report configs that collect and print time profiles for annotated regions and loops, respectively. Other configs collect event traces or per-thread profiles for post-mortem analysis. Many of the configurations are parameterizable to control output locations, formatting, or to enable additional features like MPI or CUDA API profiling. While the ConfigManager API covers many common performance analysis use cases, advanced users can also configure Caliper manually through environment variables for custom analysis tasks.
Profiling functionality
Caliper provides a range of performance measurement capabilities, including MPI function profiling and message tracing, PAPI hardware counter measurements, as well as memory analysis and memory region tracking. In addition, there are built-in high-level analyses available, such as top-down analysis for Intel CPUs.
All profiling functionality is optional and only enabled on demand, and we take care to avoid interference of the Caliper profiling functionality with production runs or third-party profiling and tracing tools. Wrapping of library functions, in particular MPI, creates a challenge in this regard. The PMPI interface is unsuitable for our purposes, because wrappers can only be enabled at link time. Instead, we use the Gotcha library, which allows us to dynamically activate MPI wrappers and enable them only when needed by the selected profiling configuration.
Conclusion
Caliper is a versatile instrumentation and profiling library to augment HPC applications with built-in performance measurement capabilities. It supports a wide range of performance engineering use cases, from lightweight always-on profiling to advanced methodologies like MPI message tracing and GPU activity analysis. One emerging use case is performance regression testing, where Caliper’s programmable control interface facilitates automated performance measurement workflows. Documentation and more information is available at https://software.llnl.gov/Caliper/index.html and the Github repository: https://github.com/LLNL/Caliper.
-- David Boehme (LLNL)
This work was performed under the auspices of the U.S. Department of Energy by Lawrence Livermore National Laboratory under contract DEAC52-07NA27344 and supported by the Office of Science, Office of Advanced Scientific Computing Research as well as the Advanced Simulation and Computing (ASC) program. LLNL-MI-812738.