When viewing a trace file in Paraver’s timeline view, it might be interesting to determine the level of parallelism within that time frame, i.e. how many MPI processes are doing computation at a given instant. If an MPI process is not doing computation, then it could be doing communication, I/O or be in an idle or waiting state. This will help identify where in the timeline the application is experiencing poor load balance.
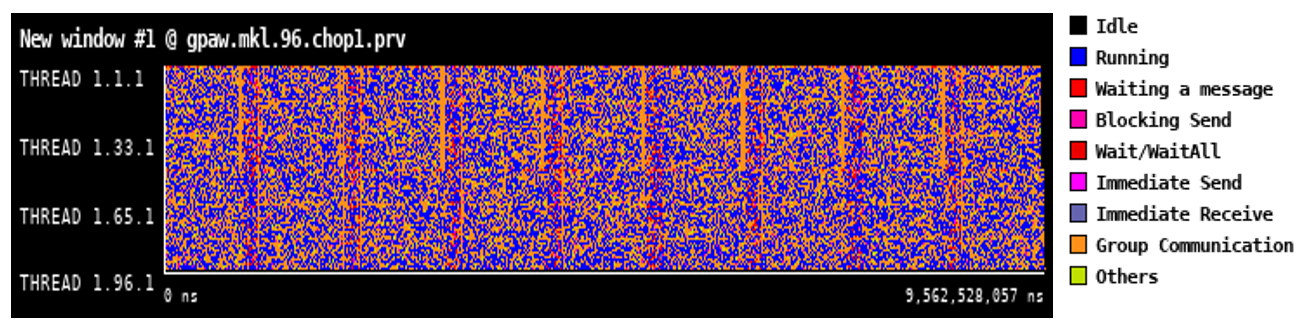
Consider the timeline below of an MPI application executing with 96 processes. There are eight orange coloured vertical lines during this execution where there is group MPI communication.
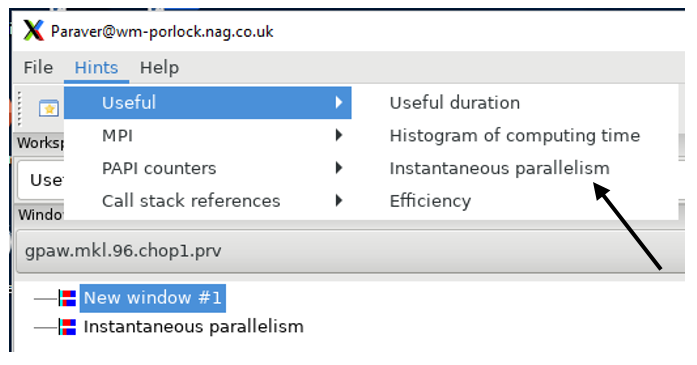 To view the instantaneous parallelism timeline, click on Hints, Useful, and then Instantaneous Parallelism in Paraver, as shown on the right:
This will present something similar to the timeline below:
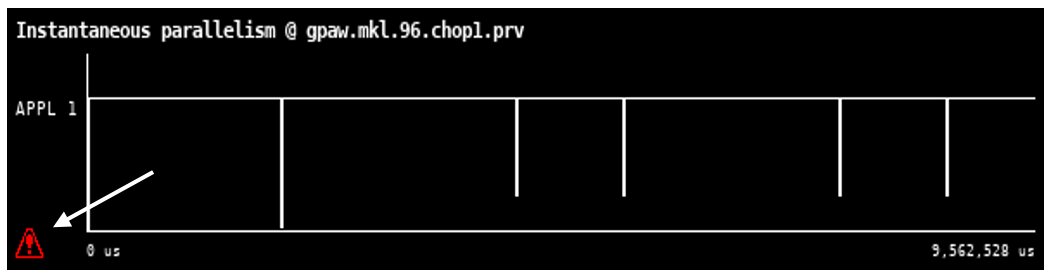
Click on the red exclamation mark inside the red triangle at the bottom left-hand side, and this should produce something similar to the following timeline:
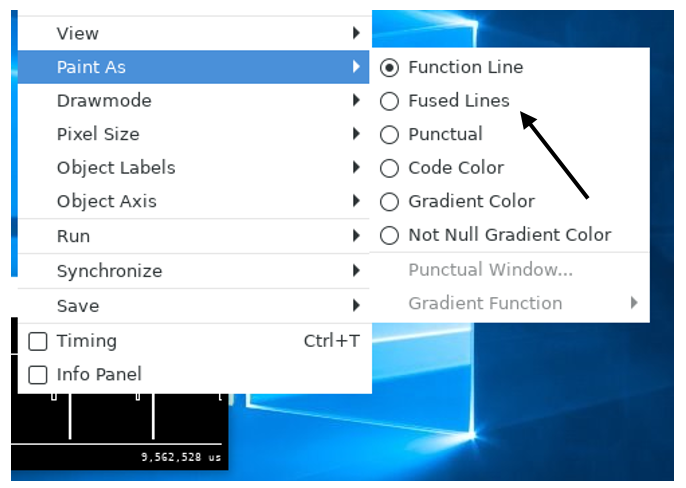 Right-click on the timeline and go to Paint As and then the Fused Lines option, as shown in the image on the right:
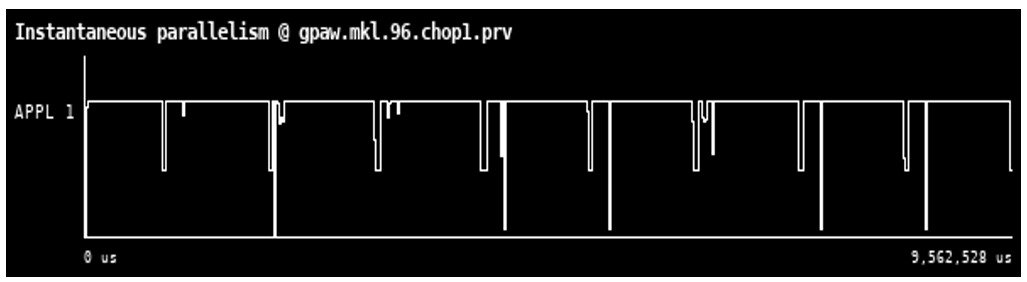
This should produce something similar to the image below:
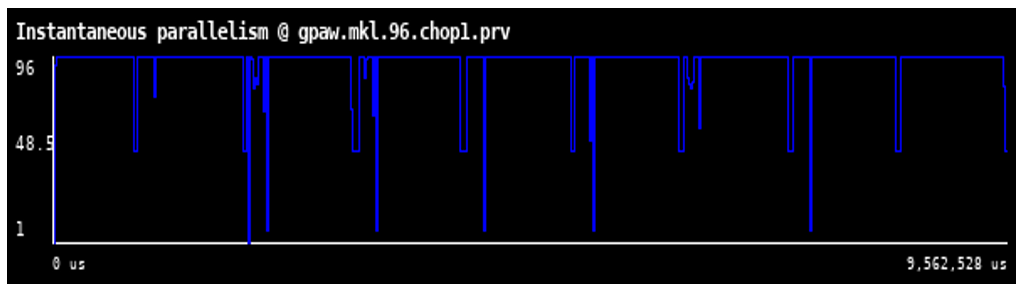
This above timeline shows the number of processes on the y-axis. The eight orange group communication lines from the first timeline match up with some of the lines on the above graph, helping to show where the load is imbalanced.