A big welcome to the second newsletter from the POP (Performance Optimisation and Productivity) CoE (Centre of Excellence). We are an EU funded project and offer free support to organisations within the EU to help improve performance of parallel software. This issue includes:
- How to apply for help from our code optimisation experts
- The new POP Helpdesk
- The POP CoE LinkedIn group
- The new webpage for POP training and learning material
- POP partner profiles
- The Barcelona Supercomputer Centre
- The Jülich Supercomputing Centre
- A few highlights from recent POP work
For those who missed it our first newsletter is now available via our website, articles include an introduction to the POP Vision, our services, the tools we use, and more.
Apply for free help with code optimisation
We offer a range of free services designed to help organisations within the EU improve performance of parallel software. If you’re not getting the performance you need from parallel software, please apply for our help via the short Service Request Form or email us to discuss further.
These services are funded by the European Union Horizon 2020 research and innovation programme - there’s no direct cost to our users!
The new POP Helpdesk
Long term support is something we take seriously, and for current and past POP users our performance experts are now available via our email helpdesk to answer your questions and point you to the appropriate resources.
If you’re having trouble analysing the code changes you’ve made, unsure of your next steps and want to check before making changes, or want to ask a question about parallel performance optimisation, just email our help desk.
New blog post - nearly 50% higher performance!
This blog post describes our proof of concept work to improve performance of HPC fluid dynamics software written in Fortran using MPI & OpenMP. Read the blog post here.
This is our third piece of work on this code. Our initial involvement was an Audit followed by a Performance Plan.
The Audit comprehensively analysed code performance and identified problems with load imbalance and made recommendations on improving serial performance. The Performance Plan took a more in depth look at the cause of the load imbalance and made further recommendations.
Audits, Performance Plans and Proof of Concept work are free of charge for organisations within the EU, they’re described in more detail on the POP website.
POP LinkedIn Group
We now have a POP LinkedIn Group, please join us there to keep up to date with our news, to ask us questions, and take part in discussions about the POP services, performance analysis methods and tools.
POP Training & Learning
We recently added a new section to the POP website to make our learning material available, so far this includes tutorials on the tools we use in performance analysis. These tools are open source and available to all.
Anyone interested in characterising performance of parallel software is recommended to read the presentation on efficiency metrics describing how we characterise performance, e.g. how we measure parallel efficiency, load balance, communication efficiency and computational efficiency.
In addition to online learning material POP also offer performance analysis workshops to developers of parallel applications. These workshops aim to work with developers on their actual code (rather than prepared exercises) to obtain performance analyses on real applications. The workshops are complemented by lectures on the performance analysis tools.
The next workshop will take place in Ostrava in the Czech Republic mid of December 2016.
For more information on POP training please email us.
POP Partner Profiles
The POP CoE consists of 6 partners and in the first newsletter we introduced two of these: The Numerical Algorithms Group and the HPC Group at RWTH Aachen.
In this issue we take a closer look at the Barcelona Supercomputer Center (BSC) and the Jülich Supercomputing Centre (JSC). The High Performance Computing Center Stuttgart and TERATEC will be introduced in subsequent newsletters.
The Barcelona Supercomputer Center Performance Tools Group
The development of performance analysis tools in Barcelona started in 1991 within a research group at the Technical University of Catalonia (UPC). After BSC's formation the Performance Tools Group became one of the main research areas within UPC’s Computer Sciences Department.

BSC are internationally recognized as HPC specialists and expert tool developers. From the very beginning BSC promoted designs and methodologies with flexibility, simplicity and the ability to interact with qualitative and quantitative information at their heart. These features allow performance analysis experts to use the same tools whether using novel homogeneous and heterogeneous multi-core architectures or using more traditional highly scalable cluster systems.
From BSC’s perspective parallel performance analysis can be considered in some sense an art, where the experience and intuition of the analyst drives the analysis and determines the quality of the results. In addition, the group’s philosophy is that more people would be undertaking performance analysis of their software if they had the necessary skills and expertise. For these reasons the Performance Tools Group at BSC continuously provides training both locally and around the world.
It was BSC’s tools, expertise, and the knowledge acquired over the last 25 years on performance analysis for HPC systems that motivated BSC to initiate and coordinate the POP service-oriented project.
The Jülich Supercomputing Centre
Operating since 1987 the Jülich Supercomputing Centre (JSC) at Forschungszentrum Jülich was the first German supercomputing centre, and
About 200 experts and contacts covering all aspects of supercomputing and simulation sciences work at JSC. JSC's research and development concentrates on mathematical and numerical modelling, especially parallel algorithms for quantum chemistry, molecular dynamics and Monte-Carlo simulations. The focus in computer sciences is on cluster computing, performance analysis of parallel programs, visualization, computational steering and federated data services.
 Services for POP are provided by the SoftWare Analysis and Tools (SWAT) Team of the JSC Application Support division. The mission of this division is support of HPC users and efficient usage of their applications on HPC systems at Forschungszentrum Jülich. Traditionally our users are based at German universities, national research institutes, and the Research Centre itself; but increasingly they come from European institutes outside Germany, from industry, and from European infrastructure projects like PRACE, LinkSCEEM, ESMI, and SOPHIA, in which our institute is actively involved.
Responsibilities of the SWAT Team include:
- optimizing user application codes
- training HPC users in performance analysis as part of PRACE PATC and VI-HPS training activities, as well as summer and winter schools
- designing, implementing and maintaining performance tools based around the Scalasca toolset
- participating in national and international research projects and the Jülich Exascale efforts IESP/BDEC, EESI, EIC, and ECL
Recent analysis highlights
We’ve recently completed various Audits, Performance Plans and Proofs of Concept, and here are a few examples of things we found.
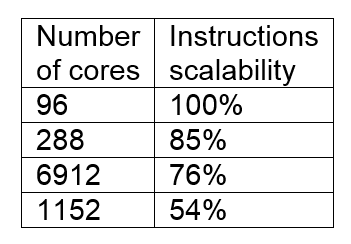
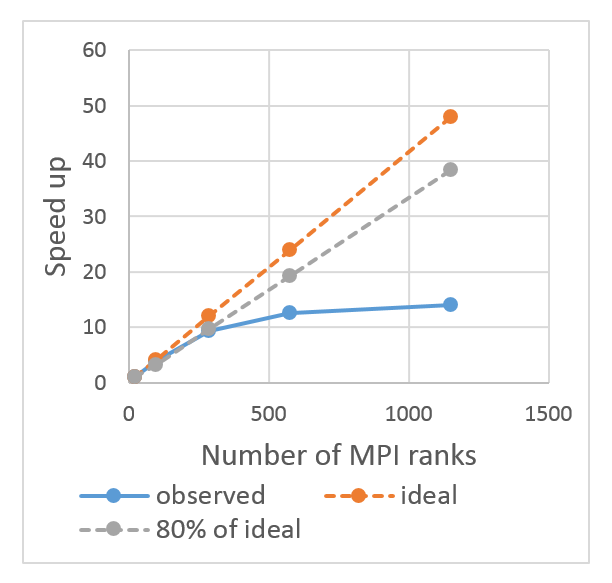
Poor instruction scalability
A Fortran code using MPI was known to scale poorly on a large number of cores. Using Extrae we generated performance data for a full size computation on 2300+ cores. Our analysis of this data identified the largest cause of poor parallel performance was that for constant problem size the total number of instructions increase with the number of cores. The additional computational work with increased core count was unknown to the code developers.
| 
|
Inter- node load imbalance
POP were asked to audit a code with known poor parallel scaling. Using Extrae and Paraver we identified significant imbalance in the number of instructions executed on each compute node, resulting in large wait times at the end of MPI regions.
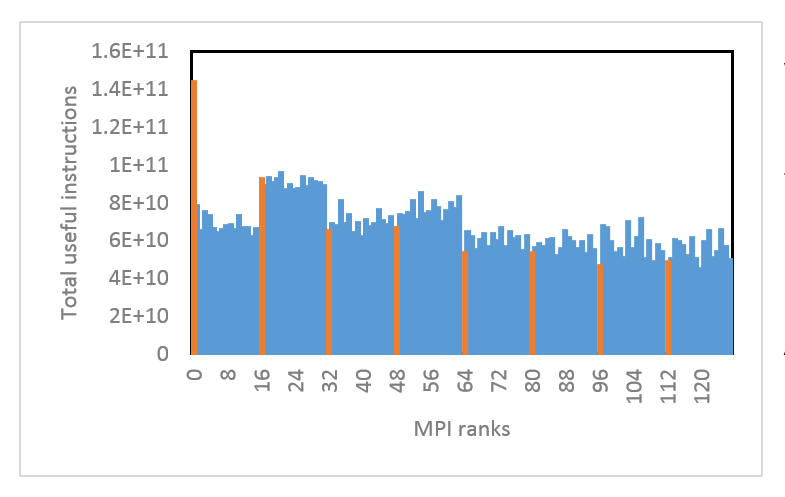
As a follow up we’ve offered to undertake a Performance Plan to investigate options for dynamic load balancing.
Load balance analysis
Score-P & PAPI were used to undertake a performance audit of Fortran90 MPI software, and the data obtained used to calculate our usual performance metrics including parallel efficiency, load balance, communication efficiency, plus computational, instructions and IPC scalability. Significant load imbalance was identified and the functions responsible were investigated further, two were found to have particularly poor load balance with respect to the number of useful instructions executed. A low value of useful IPC was also found which should be investigated further.
Analysing impact of multicore sharing
Recent analysis of hybrid MPI + OpenMP Fortran code investigated the effect of increasing threads per node for constant number of MPI processes per node. An analysis using the Paraver tool suite demonstrated a drop in global efficiency as thread count increased. It was predominantly caused by reduced IPC (instructions per cycle) due to resource sharing on the node.
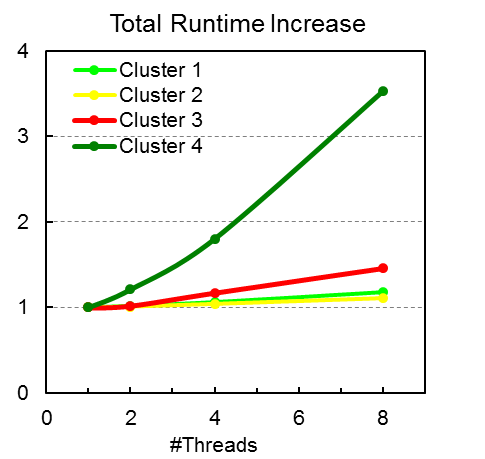
Further analysis using the Cluster Analysis Toolkit identified exactly which of the computation bursts was affected the most from poor IPC due to resource sharing. This demonstrates nicely the power of these tools in identifying the exact causes of decreased parallel efficiency.