A warm welcome to the first newsletter from the team behind the POP (Performance Optimisation and Productivity) CoE (Centre of Excellence), an EU funded project offering free of charge code optimisation services to EU organisations. In this issue:
- An overview of the POP CoE vision
- A description of our services
- Profiles of two members of the POP consortium: The Numerical Algorithms Group & The HPC Group at RWTH Aachen
- An overview of performance analysis tools developed by two of the POP partners
- Highlights from our recent performance analyses
- An analysis of service requests to date
- Meet POP CoE partners at some upcoming events
The POP CoE Vision
The idea that drives the POP CoE is a simple one: to boost productivity of EU research and industry by providing free of charge services that help improve performance of high performance computing (HPC) and parallel software. The aim of POP is to offer our world-class HPC competence to organisations that want to understand software performance issues and to adopt parallel programming best practice.
Parallel computing is now ubiquitous. For example, laptops and desktops contain multicore processors, and access to HPC can be relatively inexpensive, especially via cloud services. Thus high performance and parallel computing is a fundamental tool for a range of activities including science, engineering and research, and is an essential component of economic competitiveness.
Efficient parallelisation of computation is essential to make optimal use of parallel hardware. This is especially true for HPC where well-written parallel software is a necessity when extending the range and size of problems which can be solved. Efficiency is a first class objective in parallel software design, in particular for large scale HPC.
However, the complexity of parallel software engineering is often problematic, and this complexity is likely to increase in coming years. In our experience code owners (and users) are not always aware of the poor performance of their applications. Even when code developers recognise the need to improve parallel efficiency they may not have the necessary skills and experience needed to identify the causes of problems and find appropriate solutions, resulting in costly failed attempts to rewrite and tune code.
For these reasons the POP Centre of Excellence has been established. We offer help from a unique combination of world-class HPC expertise from six renowned organisations based in Spain, Germany, the UK and France. Our services are designed to help organisations understand performance of parallel software and to reduce the waste and costs associated with poorly performing parallel code. These services can help you obtain quicker time to solution, make more efficient use of HPC resources, and see a larger return on investment from optimising code.
The POP CoE Services
We offer a portfolio of services designed to help our users optimise parallel software and understand performance issues. Whilst our primary customers are code developers & owners our services are also available to code users and infrastructure & service centres.
We want to emphasise that our services are free of charge to EU organisations, and also that we offer a long term relationship to our users rather than one off support. To discuss these services please get in touch with us via email (pop@bsc.es) or apply via our website https://pop-coe.eu/contact.
Our main services are: Performance Audits, Improvement Plans, Proof-of-Concept demos, and Training.
- Performance Audits are an initial analysis measuring a range of performance metrics to assess quality of performance and identify the issues affecting performance.
- Improvement Plans undertake further performance evaluations to qualify and quantify solutions and estimate potential improvements.
- Proof of Concept work uses extracted application kernels to demonstrate actual benefits from tuning and optimisation.
- Training offers events and materials covering parallel profiling tools, programming models and parallelisation approaches.
Our team of experts analyse a range of properties including:
- Instructions Per Cycle (IPC) of sequential computation to identify regions operating below core peak performance e.g. due to issues with memory hierarchy, instruction mix, non-pipelined instructions and dependences.
- Load imbalance caused by different amounts of work per process (computational imbalance) or different performance per process (e.g. different IPC or cache miss ratios) or a combination of both.
- Serialisation – delays caused by dependencies between code regions.
- Data transfer – costs of non-overlapped data transfer between processes.
- Amount of instructions and type of instruction – i.e. is the algorithm optimal in terms of computational & instruction complexity and code balance?
- I/O – the impact of I/O on efficiency.
POP Partner Profiles
The POP CoE consists of 6 partners, The Barcelona Supercomputer Center (BSC), High Performance Computing Center Stuttgart (HLRS), Juelich Supercomputing Centre (JSC), Numerical Algorithms Group (NAG), RWTH Aachen and TERATEC.
All the partners will be introduced over the course of the next couple of issues of this newsletter. Here we start with The Numerical Algorithms Group and The HPC Group at RWTH Aachen.
The Numerical Algorithms Group (NAG)
NAG provides numerical software, consulting and high performance computing expertise to academia and industry. NAG was founded in 1970 as a collaboration between the universities of Birmingham, Leeds, Manchester, Nottingham and Oxford, and what is now known as the Rutherford Appleton Laboratory. In 1971 NAG developed the NAG Library, which has subsequently become the largest commercially available collection of high quality mathematical and statistical algorithms.
 NAG has a background in helping academics and commercial organizations make better use of their HPC systems by improving the performance of the codes that run on them. This experience is directly relevant to the services that are provided by the POP project. NAG's track-record of success in HPC code performance optimisation can be seen in a range of case studies presented online at www.nag.co.uk; in over 80% of studies where improved code performance was the main aim, NAG's expertise resulted in speed-ups of at least 2x. These results were achieved using a range of techniques including data restructuring and implementing algorithms appropriate to new HPC architectures. In addition, NAG provides practical experience and support for procuring large supercomputers and associated support services, and in strategy development.
Alongside its work in the HPC field, NAG provides a range of services to help organisations find and implement numerical computation solutions. These include finding the best ways to solve complex problems and verifying that older applications remain valid and optimal for the latest processors and platforms. Additionally, NAG has been enlisted to help develop some externally-produced numerical libraries.
The HPC Group at RWTH Aachen
 As a central facility of the RWTH Aachen University the IT Centre offers resources and services to all institutes, members and students of the university. This includes the operation of RWTH Aachen’s HPC cluster and support for users from Aachen and the state of North Rhine-Westphalia. Performing these service activities is part of the daily business of the HPC group at the IT Centre, a group of about 15 people. As part of the service activities, the HPC group has run user training for more than 15 years in the area of parallel programming and performance optimisation. These training courses are not only given in Aachen, but all around the world, including tutorial sessions at international conferences like SC and ICS. Furthermore, the HPC group has optimised numerous HPC applications in collaboration with institutes of the university to guarantee efficient use of the HPC resources. To be able to perform performance optimisation in all areas, members of the HPC group are well trained in the use of performance tools, either open source tools like Scalasca or commercial tools, e.g. from Intel or Oracle.
Besides these services, the HPC group performs research in different areas. One focus is shared-memory parallelisation, particularly OpenMP, with a focus on large shared memory systems. The group actively contributes to the OpenMP specification as a member of the OpenMP architecture review board. A further research focus is the area of correctness checking in parallel applications and the development of the MUST correctness checker. MUST performs analysis of parallel applications for typical MPI programming errors, like deadlocks, and an extension for hybrid MPI/OpenMP programs is under active development. In the area of performance analysis, the HPC group participated in three projects to develop and improve the performance measurement infrastructure Score-P. A focus here was to ensure that Score-P is well suited for OpenMP and hybrid MPI/OpenMP applications.
POP’s Performance Analysis Tools
Two members of the POP partnership develop powerful performance analysis tools which are used extensively in our work.
The Barcelona Supercomputer Center (BSC) Performance Tools
The performance analysis tools developed at BSC provide a detailed analysis that allows understanding of an application’s behaviour as well as identifying performance critical issues. They provide insight not only into the application itself but also into the underlying system.
The core tool is Paraver, a trace-based performance analyser with great flexibility to explore and extract information. Paraver provides two main visualisations: timelines that graphically display the evolution of the application over time, and tables (profiles and histograms) that provide statistical information. These two complementary views allow easy identification of computational inefficiencies such as load balancing issues, serialisations that limit scalability, cache and memory impact on the performance, and regions with generally low efficiency.
Furthermore, Paraver contains analytic modules, for example the clustering tool for semi-automatic detection of the application structure, and the tracking tool to detect where to improve code to increase scalability.
In addition, the Dimemas simulator allows a fast evaluation of what-if scenarios for message passing applications, for example to understand the benefits of moving to a machine with a faster network, or the improvements obtained if an application was better balanced.
The performance data collection is done with Extrae. Extrae intercepts the main parallel runtime environments (MPI, OpenMP, OmpSs, Pthreads, CUDA, OpenCL, SHMEM) and supports all major programming languages (C, C++, Fortran, Python, JAVA). It has been successfully ported to a wide range of platforms like Intel, Cray, BlueGene, Fujitsu Spark, MIC, ARM, and even Android. On most platforms the preload mechanism enables us to avoid specific compilations and to work with the unmodified production binary.
The performance tools from BSC are freely available as Open Source software. You can find more information at our website http://www.bsc.es/paraver or contact us via e-mail: tools@bsc.es.
The Jülich Supercomputing Centre (JSC) Performance Tools
The Jülich Supercomputing Centre develops Scalasca and associated tools for scalable performance analysis of large-scale parallel applications that are deployed on most of the largest HPC systems including Blue Gene/Q, Cray, Fujitsu, K Computer, Stampede (Intel Xeon Phi), Tianhe, Titan and others. The Score-P instrumentation and measurement infrastructure, developed by a community including RWTH Aachen University, supports runtime summarisation and event trace collection for applications written in C, C++ and Fortran using MPI, OpenMP, Pthreads, SHMEM, CUDA and OpenCL. For scalability, event traces are analysed via a parallel replay with the same number of processes and threads as the measurement collection, generally re-using the same hardware resources. This has facilitated performance analyses of parallel application executions with more than one million MPI processes and over 1.8 million OpenMP threads.
 Scalasca trace analysis characterises parallel execution inefficiencies beyond those captured by call-path profiles. It detects wait states in communications and synchronisations, such as the "Late Sender" where receive operations are blocked waiting for associated sends to be initiated, and the root cause of these, such as excess computation or imbalance. Also contributions to the critical path of execution are quantified to highlight call-paths that are the best candidates for optimisation.
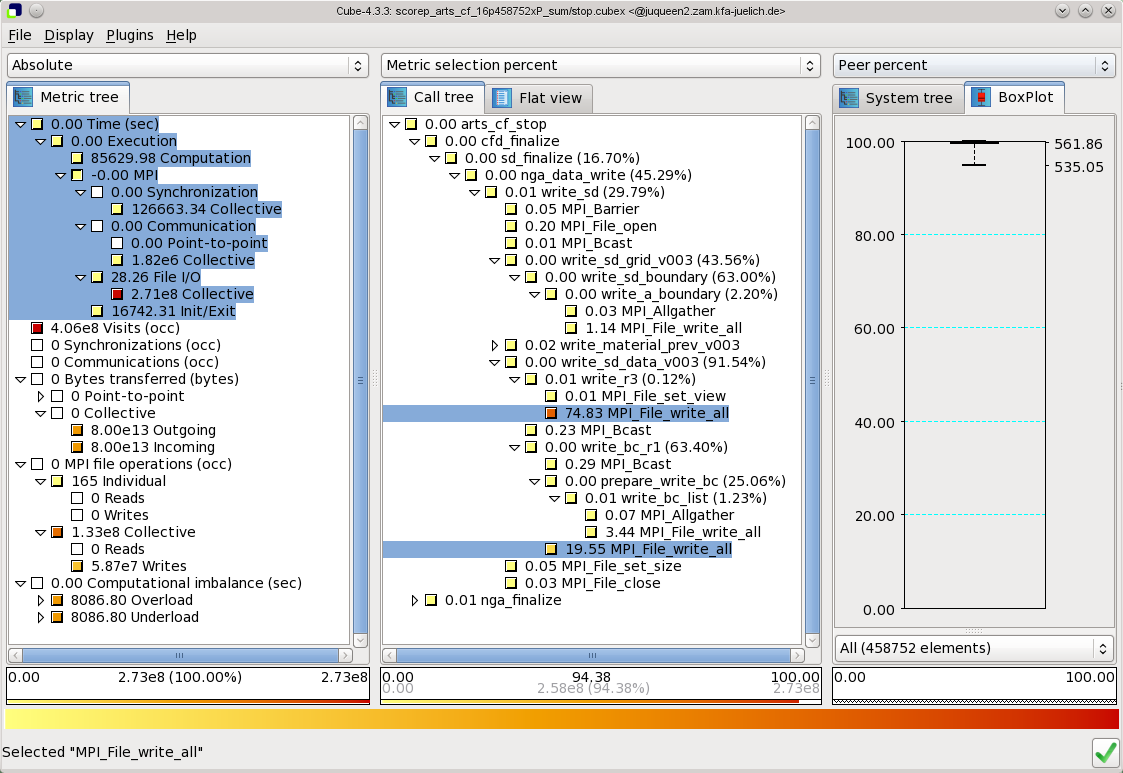
Scalasca and Score-P quantify metric severities for each call-path and process/thread, storing them in analysis reports for examination with the Cube GUI or additional processing via a variety of Cube utilities.
Additional wait-state instance statistics can be used to direct Paraver or Vampir trace visualisation tools to show and examine the severest instances.
The performance tools from JSC are freely available as Open Source software. More information is available from the project website http://www.scalasca.org/ or via e-mail: scalasca@fz-juelich.de
Performance Analysis Highlights
We present some performance issues recently identified by the POP CoE team, these precise understandings of the causes behind performance issues are essential to efficiently optimise software.
MPI communication issues
The code used asynchronous MPI communication to overlap communication and computation but still exhibited poor parallel scaling. On 48 cores efficiency was 61% and efficiency reduced steeply beyond this. 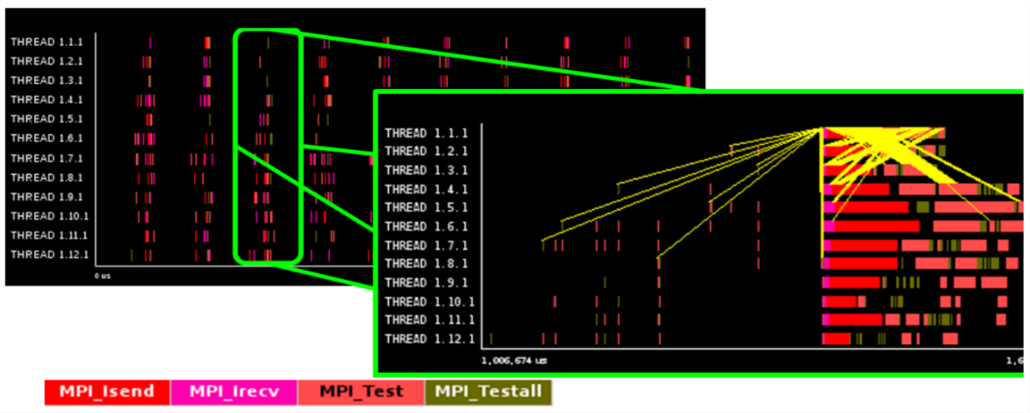
By using the Extrae and Paraver tools we identified that messages are sent to lower ranks in ascending order, leading to endpoint contention at the receiving rank and significant waiting time for sending ranks. This is shown in the timeline where communications are in yellow.
These communication issues are exacerbated by the sending of many small messages. For example, over 100,000 messages for 12 MPI ranks and increasing with total number of processes.
These problems can be resolved by randomising the order of communication and packing messages into larger sets for sending, or replacing asynchronous MPI calls by one-sided calls so remote processes can do useful work instead of waiting for data.
MPI load imbalance
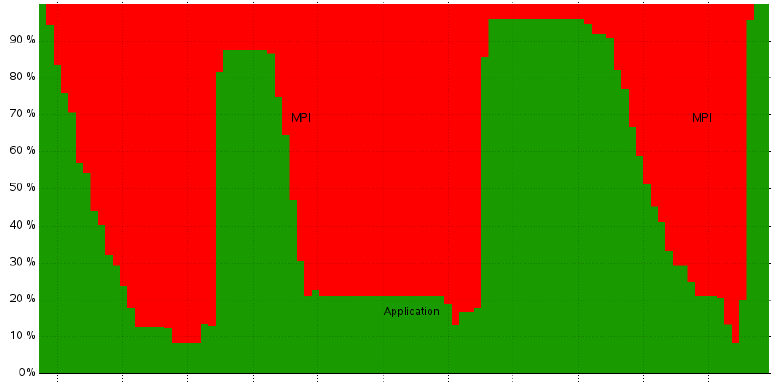 A performance analysis was requested for MPI code with known weak computational performance. Using Score-P and Vampir we identified significant load imbalance across MPI ranks caused by imbalance in the instructions completed per rank, this resulted in significant MPI waiting times.
This was a revelation to the code developers who had statically decomposed their problem into equal sized blocks for each MPI rank. This load imbalance can be seen in the timeline which shows fraction of processes in MPI (red) and in application code (green).
Poor Computational Performance
Code developers of magnetic simulation code (C++ & MPI) wanted to improve performance.
Our initial performance audit identified poor cache usage and unvectorised loops caused by overwriting temporary arrays during each loop iteration. These vectorisation problems are resolvable using arrays that are the same size as the number of loop iterations. By implementing our recommendations, the code developers were pleased to obtain a x2 performance improvement.
OpenMP load imbalance
This C++ hybrid (MPI & OpenMP) code simulates two-phase flows and makes heavy use of inheritance and templates. Despite the challenges and complexities of analysing hybrid object-oriented code we identified master threads were performing twice the work of the other threads, resulting in significant wasted CPU cycles.
New blog post - 10X improvement for OpenMP code
OpenMP software obtained a 10x performance improvement on 128 core SMP hardware after a POP performance analysis, improvement plan and proof-of-concept work.
Read the blog post here.
Breakdown of our users’ codes
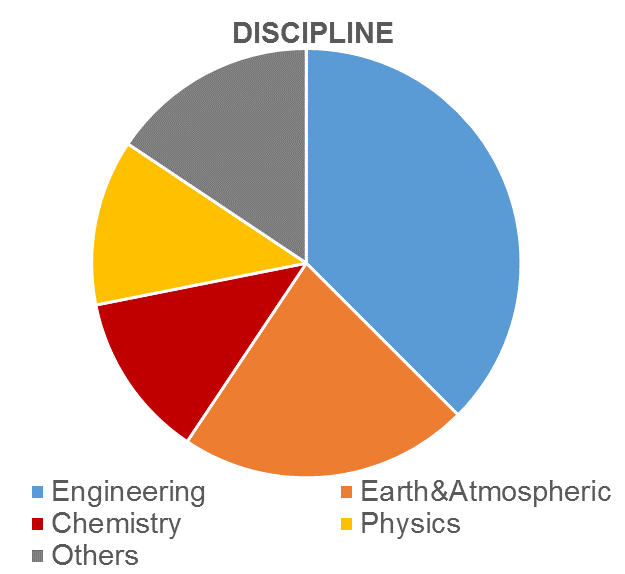
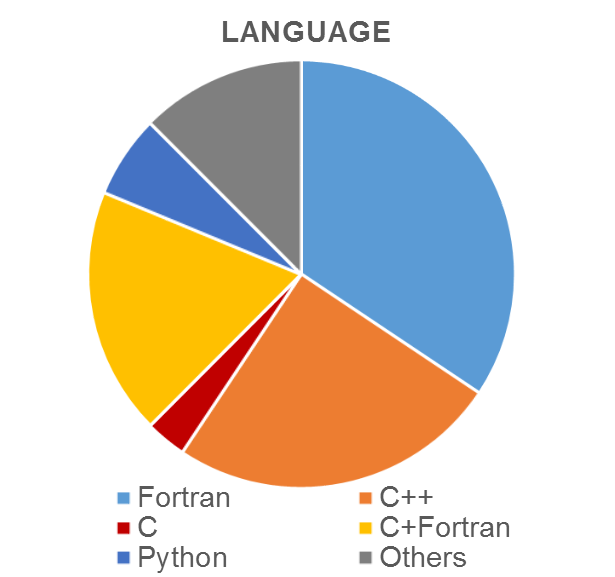
In this article we take a quick look at the type of software profiled since the start of the POP project to demonstrate the breadth of our work.
Perhaps unsurprisingly, most applications so far have been from traditional disciplines for HPC, i.e. engineering, earth & atmospheric sciences, chemistry and physics. The programming languages used by our clients are likewise mostly the traditional high-end computing languages, i.e. Fortran, C & C++, including mixed C/Fortran software, the ‘Others’ category includes Java, and mixed C/C++ and Fortran/C++. It is interesting that 6% of the software uses Python which is perhaps an emerging language for parallel computing.
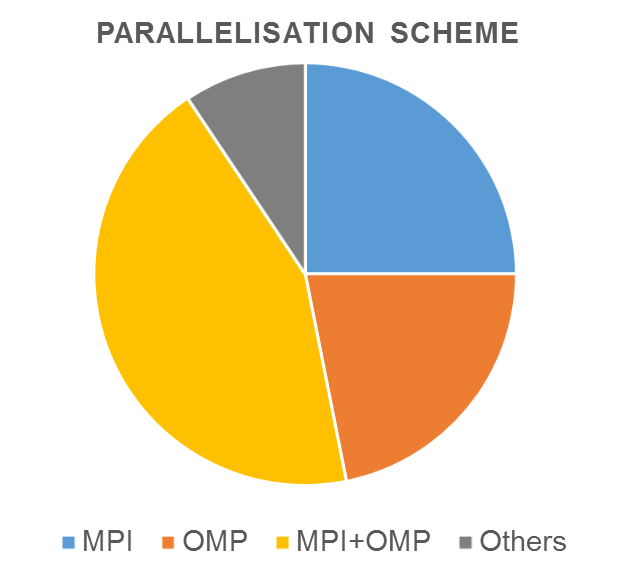
A breakdown of parallel methodology shows a large adoption of hybrid parallelism using MPI + OpenMP which makes profiling more challenging. The ‘Other’s category includes Java threads, Pthreads, TBB & PGAS.
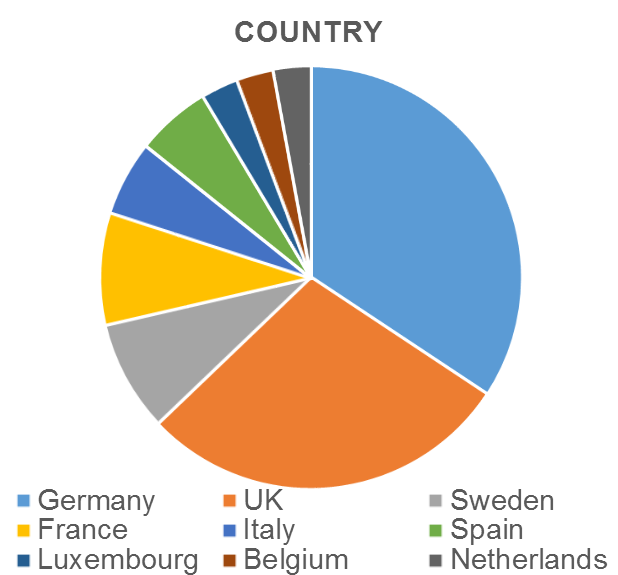
We’d be very interested in hearing from code developers in other disciplines and from other EU countries.
 |
 |
 |
 |
Meet POP CoE partners at some upcoming events
POP @ ISC 2016
Come to our POP BoF at ISC 2016 on June 21 or visit our experts at the research booths of BSC (#1202), NAG (#518) or JSC/HLRS (#1310).
POP @ Teratec Forum
POP represented by BSC and NAG will be at the "European Research Cafe" in the Teratec Forum on June 28 and 29, 2016 in France.
POP @ HPCS 2016
POP, represented by NAG, will present a poster at the HPCS 2016 conference on July 18 to 22, 2016 in Austria.