Hybrid MPI and OpenMP parallelisation is a popular way to increase the scalability of MPI codes. This reduces the number of MPI processes, thus reducing the amount of buffer memory required for data transfer and the size of the communicators. The OpenMP region is usually created per NUMA region or per compute node. The communication can be either done in the OpenMP serial regions, or within an OpenMP region and handled by the master thread (thread 0). Alternatively, the communication can be done by all threads, but support for this model is limited by the MPI implementations or suffers from performance issues due to complex internal MPI locking.
Whilst conceptually the hybrid parallel model should increase performance, there are some potential performance issues to be aware of. Ideally, as much code should be enclosed in OpenMP to ensure greater levels of parallelism. The code not encapsulated in OpenMP blocks are known as serial or sequential regions. If the serial region is too large, then the level of parallelism will be limited and constrained by Amdahl’s law. Measuring this level of serialisation can be difficult and is not obvious. However, this serialisation can be measured using the Scalasca parallel profiling tool and this article will describe how to achieve this.
First enable profiling and tracing in Score-P by setting the following environment variables prior to the application execution and measurement (the dollar sign $ is the Linux prompt):
$ export SCOREP_ENABLE_PROFILING=true
$ export SCOREP_ENABLE_TRACING=true
Then execute your code with the scan command prefixed:
$ scan mpirun -n 4 bin/bt.A.x
This will create files in the following experiment directory:
scorep_<application>_<number of procs>_trace/
The files in the above directory will then need to be remapped to calculate the OpenMP serialisation metric and organise the performance metrics in a hierarchical manner using the following command:
$ square -v -F scorep_<application>_<number of procs>_trace/
This will create two files in the experiment directory: summary.cubex and trace.cubex, which need to be merged:
$ cube_merge -o pop_all.cubex summary.cubex trace.cubex
The remapped file is pop_all.cubex will then contain additional metrics in an organised and hierarchical manner, which then needs to be opened in Cube:
$ cube pop_all.cubex
This should show something similar to the following:
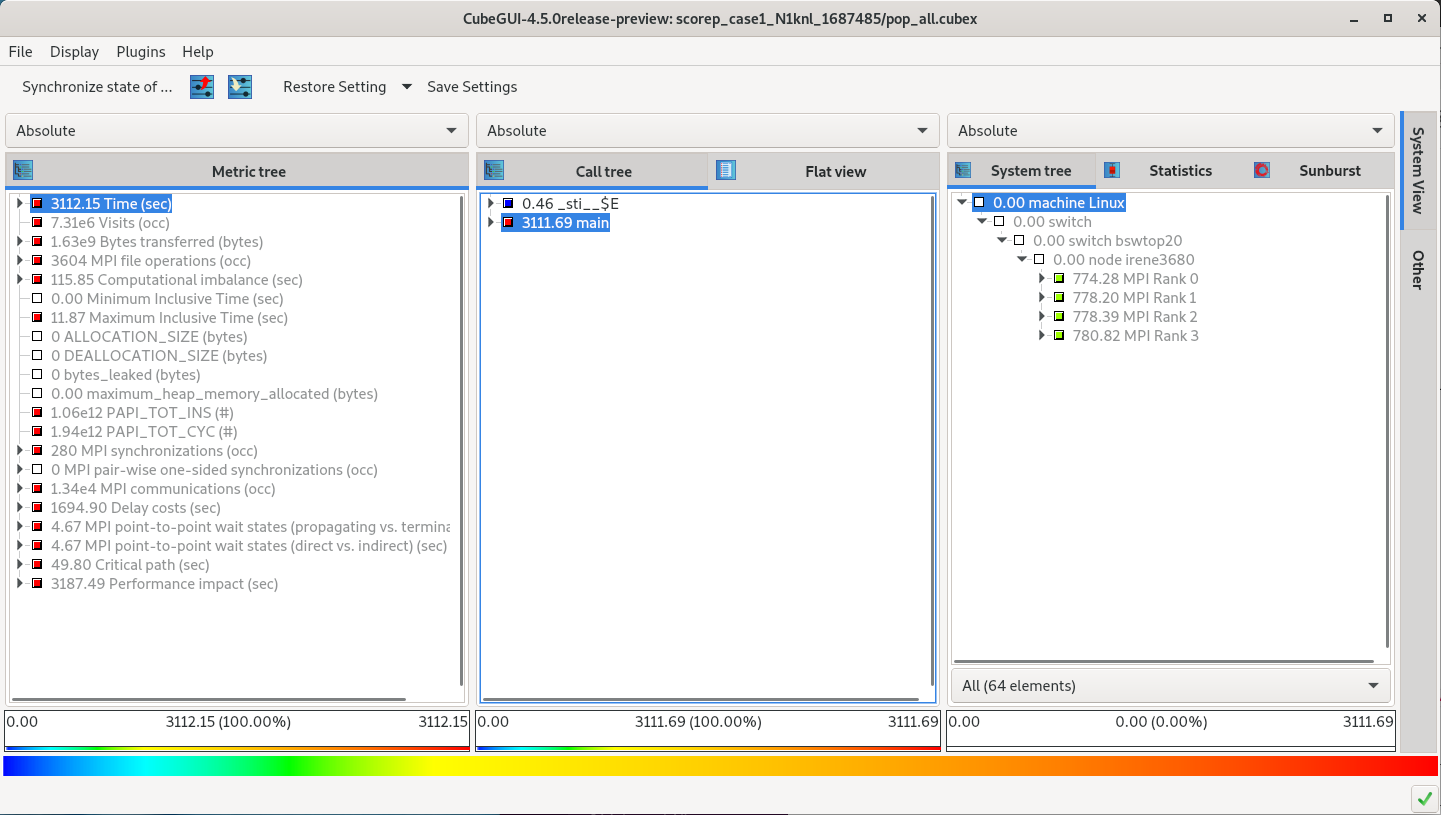
On the far left, the metrics are shown in a hierarchy which can be expanded by clicking on the right arrow in the metrics column on the “Metric tree” panel on the left. This shows that the application spent 3112.15 seconds (total time) by all threads. By clicking on the “Time (sec)” metric right arrow, you should see something similar to:
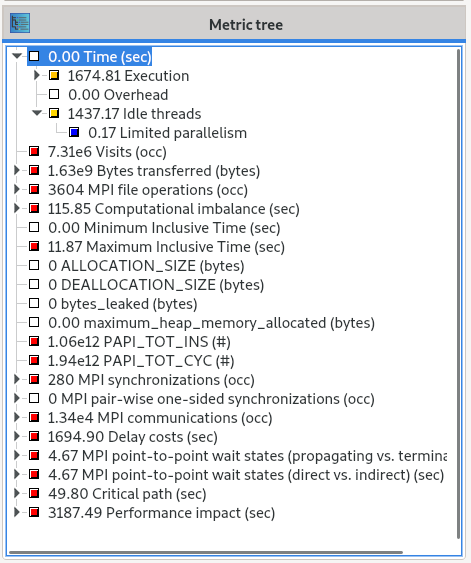
The metric of concern is the “Idle threads” metric, which is described in the Scalasca documentation as:
Idle time on CPUs that may be reserved for teams of threads when the process is executing sequentially before and after OpenMP parallel regions, or with less than the full team within OpenMP parallel regions.>/em>
In this example, “Idle threads” metric shows 1437.17 seconds which is the amount of time the application was spending in OpenMP serial sections for MPI processes.
A useful metric for application performance is the fraction of the application time spent in serial sections as if this is large it indicates that the hardware is not being utilised efficiently. It is calculated as time spent in idle threads divided by total application runtime. I.e. for the example application here

So slightly less than half of the application time was being spent in OpenMP serial sections. This implies that OpenMP serial execution is an issue for this code and will require further investigation to determine how this serial code may be efficiently parallelised.