Intel VTune Amplifier is a powerful tool for profiling code written in a variety of languages including C/C++, Fortran and Python. It can be used on parallel code that uses paradigms such as OpenMP, MPI and Intel Thread Building Blocks (TBB), as well as on serial code.
One useful feature of VTune is that it supports a set of Instrumentation and Tracing Technology (ITT) APIs that allow developers to programmatically control and augment the tracing of their applications. These are native C/C++ functions that can easily be called from code written in these languages. It is also possible to call them from Fortran code with little extra work. Even though VTune supports the profiling Python code, however, there are no native Python ITT bindings provided out-of-the-box by Intel.
This shortcoming has been addressed by the National Energy Research Scientific Computing Center (NERSC), who have made Python bindings for a subset of the ITT APIs available via their Github page as the itt-python package. Their contribution covers two of the most useful APIs: Collection Control and Task.
The Collection Control API allows developers to turn VTune's tracing on and off from within an application's source code. This is extremely useful as it allows you to only collect information about a particular region of interest (e.g. function or module) within a much larger code-base that would otherwise generate extremely large trace files or impose too much of a tracing overhead if the whole execution were traced. The itt-python package provides three functions pause(), resume(), and detach() that permit pausing, resuming and finishing tracing respectively. A typical use for them is illustrated in the itt-python documentation:
import itt
# ... uninteresting code (not profiled)
itt.resume()
# ... very interesting code (profiled)
itt.pause()
# ... boring stuff again (not profiled)
itt.resume()
# ... interesting code (profiled)
itt.detach()
# ... uninteresting code like writing output (not profiled)
The Task API allows users to annotate the timeline that VTune produces from tracing an application's execution with markers that identify when certain events in the source-code have occurred. To enable this, itt-python provides three functions: domain_create(name), task_begin(domain,name), and task_end(domain). Domains give names to groups of tasks which can be used to filter trace results to only show certain subsets of tasks. Tasks are named regions of code that will become visible on the timeline, and are also entities that can be analysed by VTune's performance metrics.
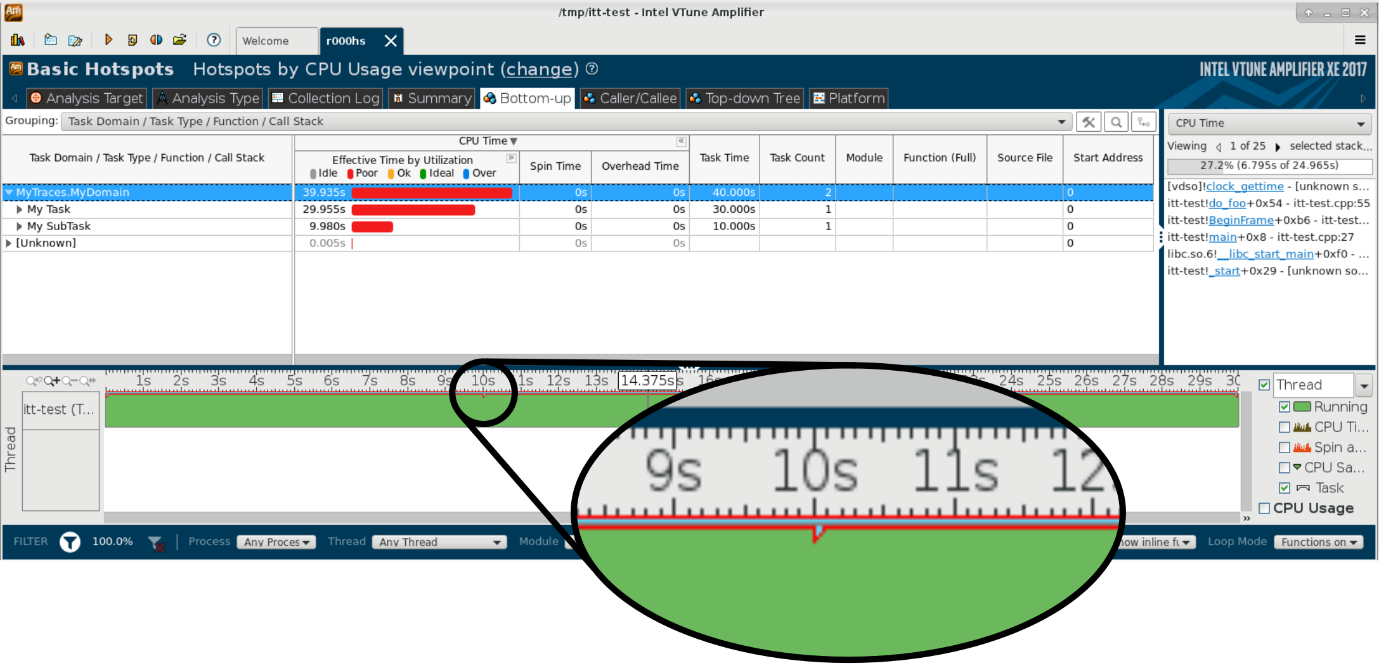
The screenshot shows VTune's visualisation of the trace of the sample code given in the Task API's documentation. Note how the timeline at the bottom shows red and blue markers at the top of the green bar to delineate the durations of tasks and subtasks – this is shown in more detail in the zoomed-in portion. The analysis metrics in the main pane have also been grouped at the task level.