The Intel Trace Analyzer and Collector (ITAC) profiling tool allows application developers to profile their MPI applications. The tool provides statistics on the application’s MPI profile, a timeline and the application execution on an ideal network, i.e. zero latency and infinite bandwidth. When profiling large applications, it is sometimes useful to just focus on a specific region of the application, e.g. the time iteration loop, which excludes initialisation and finalisation stages. This makes the profiling easier to view and helps developers focus on the most time-consuming aspects of their code.
The ITAC API can be used to create specific regions of interest. To use the API, include the following headers files in your code depending on whether your code is C/C++ or Fortran:
C/C++:
#include <VT.h>
Fortran (including FORTRAN 77). API calls are implemented as subroutines:
include 'VT.inc'
To create a region of interest in ITAC, a handle must be allocated for a class name:
C/C++:
int VT_classdef( const char *classname, int *classhandle )
Fortran:
VTCLASSDEF( classname, classhandle, ierr )
CHARACTER *(*) classname
INTEGER classhandle, ierr
The returned value is the classhandle which is then used to create a handle for a state:
C/C++:
int VT_funcdef( const char *symname, int classhandle, int *statehandle )
Fortran:
VTFUNCDEF( symname, classhandle, statehandle, ierr )
CHARACTER *(*) symname, classname
INTEGER classhandle, ierr
An example symbol name is Running. The returned value is statehandle which will then be used to begin and end a region of interest. Then to begin a region of interest, use:
C/C++:
int VT_begin( int statehandle )
Fortran:
VTBEGIN( statehandle, ierr )
INTEGER classhandle, ierr
And finally, to end a region of interest, use:
C/C++:
int VT_end( int statehandle )
Fortran:
VTEND( statehandle, ierr )
INTEGER classhandle, ierr
All successful function or subroutine (ierr return status) calls should return VT_OK. Below is an example Fortran code that utilises the above subroutines:
    include 'VT.inc
    integer :: ierr, classhandle, statehandle

    call MPI_INIT( ierr )
    call VTCLASSDEF( 'ROI', classhandle, ierr )
    call VTFUNCDEF( 'Running', classhandle, statehandle, ierr )
    ! some initialisation code here

    call VTBEGIN( statehandle, ierr )
    ! some computationally intensive region of interest (ROI)
    do i = 1, Ni
      do j = 1, Nj

      end do
    end do

    call VTEND( statehandle, ierr )
    ! some finalisation code here
    call MPI_FINALIZE( ierr )
As can be seen, all ITAC API calls must be enclosed between MPI_INIT and MPI_FINALIZE. It is an error to call them outside these calls. To compile your code, add the following include flag:
-I${VT_ROOT}/include
To link your code to create the final executable, use the following link flags:
-L${VT_SLIB_DIR} -lVT ${VT_ADD_LIBS}
where the variables are obtained from the Linux script itacvars.sh and during execution of your code (bt.A.9 in the example below), add the trace flag as shown:
mpirun -trace -n 9 ./bt.A.9
This which will create a number of trace files beginning with bt.A.9.* in the current working directory. Then to load the trace file using the ITAC GUI, use the command:
traceanalyzer bt.A.9.stf
For your own application, the file to load will be <application name>.stf and uses ITAC’s own trace file format. When loading the GUI, from the summary page, click on Continue and then go to Charts → Event Timeline which will show something similar to the image below:
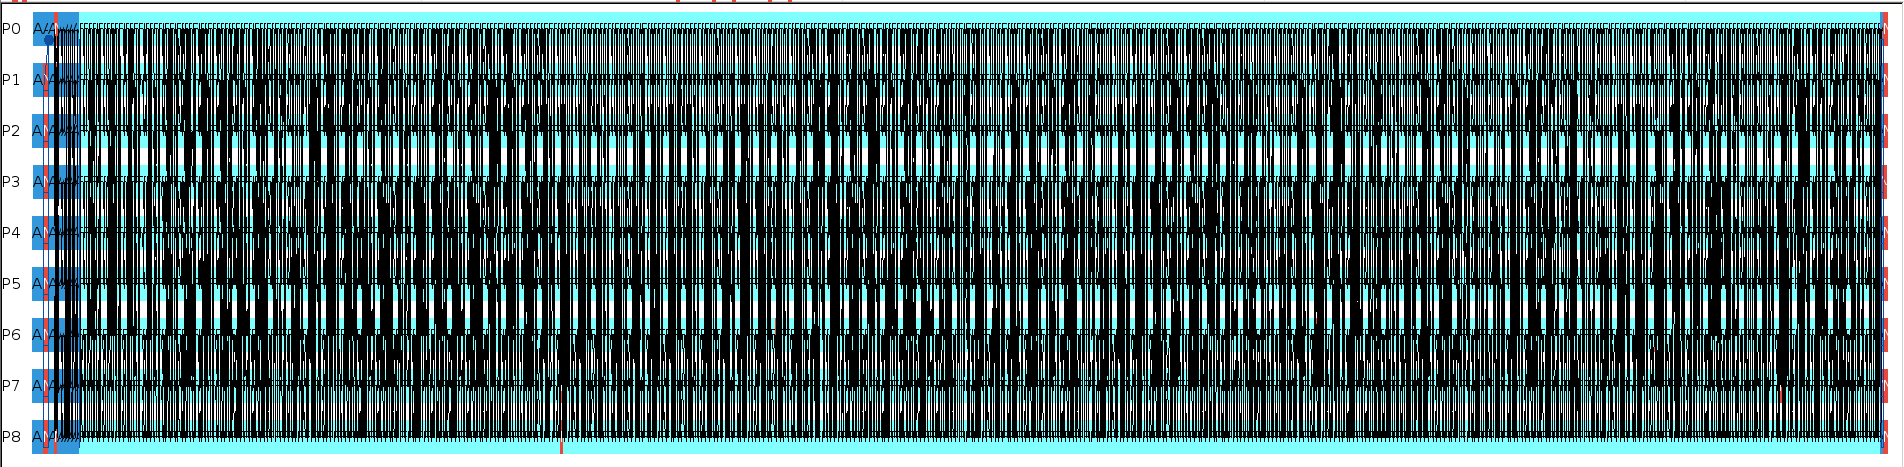
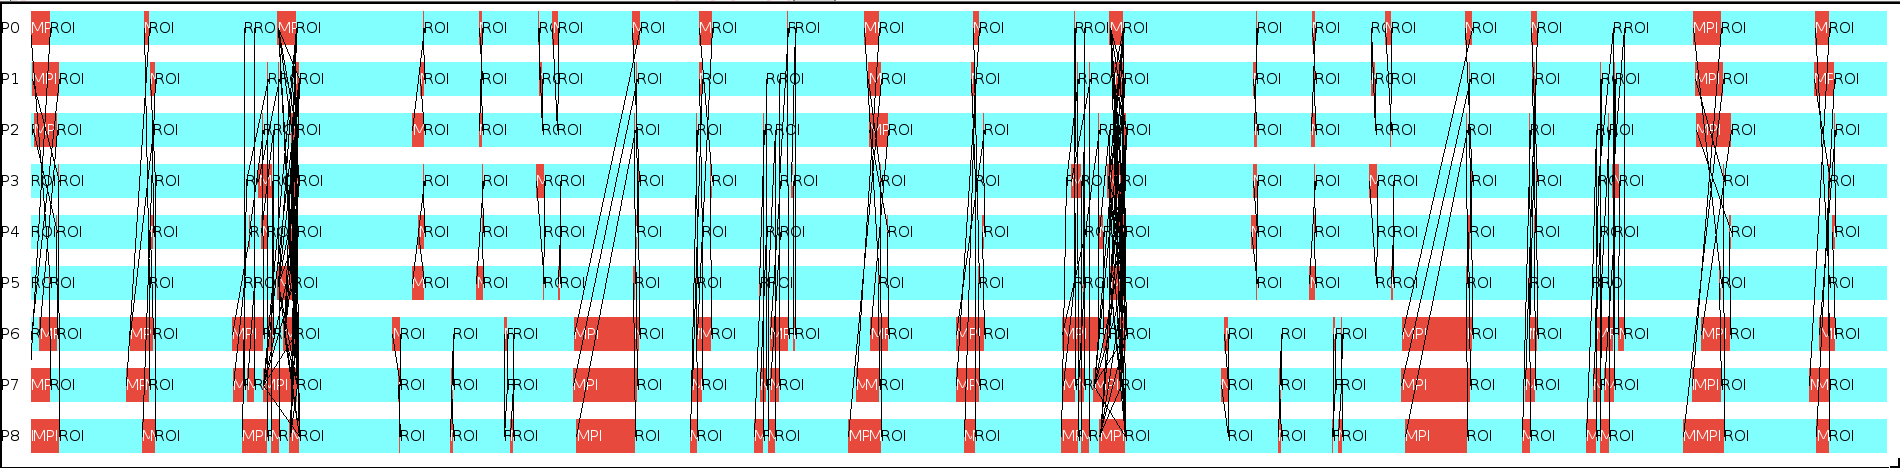
The region of interest labelled ROI (class name) is shown in light blue and the region outside ROI is shown in blue. The black lines show MPI communication. Zooming into the timeline will show the labelled region of interest:
For further information on the ITAC API, click on this link. A recent webinar on ITAC by a POP expert can be viewed here.