One of the essential steps to create a good performance measurement when using Score-P is to limit the intrusion of the measurement into the run time of the application. With another words, the user needs to limit the measurement overhead.
There are various methods to achieve it. One can limit the measurement on the region of interest and let the measurement system collect data only during the execution of this region. This can be done either by using selective recording or manual user instrumentation. Doing so reduces the overhead to the minimal amount for a given case and that is the way to go.
However, for that user needs to know this region and often that is not the case. Most of the time a performance measurement has to be done in order to find regions which have a negative impact on the run time. In this case one starts with “Instrument all” scenario and reduces step-by-step the overhead by incrementally creating a measurement filter.
There are two options, to use compiler filtering capabilities where applicable or to use the Score-P run time filter. A Score-P run time filter, once created, can be used directly for compile time filtering with the Score-P GCC plugin or with minimal adaptation with the filtering interface of the Intel compiler.
In the first case, one provides a filter file to the compiler while compilation and compiler excludes the selected regions from the instrumentation. In this way no measurement system code is executed at all and hence, the overhead for the filtered regions is equal to zero.
In the second case, one provides a filter file to the Score-P via environment variable. Score-P tests then for every region enter if it should be filtered or not. In case of filtering Score-P leaves the region immediately introducing the minimal overhead possible.
Creation of the filter file usually is done using "Summary experiment scoring". An alternative method is to:
-
Create a profile measurement;
-
Examine the obtained “profile.cubex” using “scorep-score” with or without filter file;
-
Create filter file using “EXCLUDE *”;
-
Add all region names manually;
-
Go to step 2 till reported overhead is acceptable and amount of the required memory for the Score-P is sufficient;
-
Perform new measurement using the created Filter File;
Unfortunately, these steps are applicable only for the Score-P’s filter file. For the Intel instrumentation filtering one would have to recompile and to rerun the application after every filter file modification in order to find the optimal filtering rules. Ideally one would have for both cases one method with steps like these:
-
Create an initial unfiltered measurement;
-
Examine result using CubeGUI;
-
Mark all regions to filter and see immediately how much memory one would need and how big would be the trace file and, perhaps, how big would be the overhead.
-
Save created rules in “Score-P” or “Intel” format
-
(Recompile and ) rerun measurement with the created filter file;
Precisely this method of filter creation is provided by ScorePion plugin.
The user opens the “profile.cubex” file, selects the “ScorePion” plugin (see Figure 1 below) in the plugins Tab “Others” and selects the “Flat view”. Best to sort the flat profile by the “Exclusive value”.
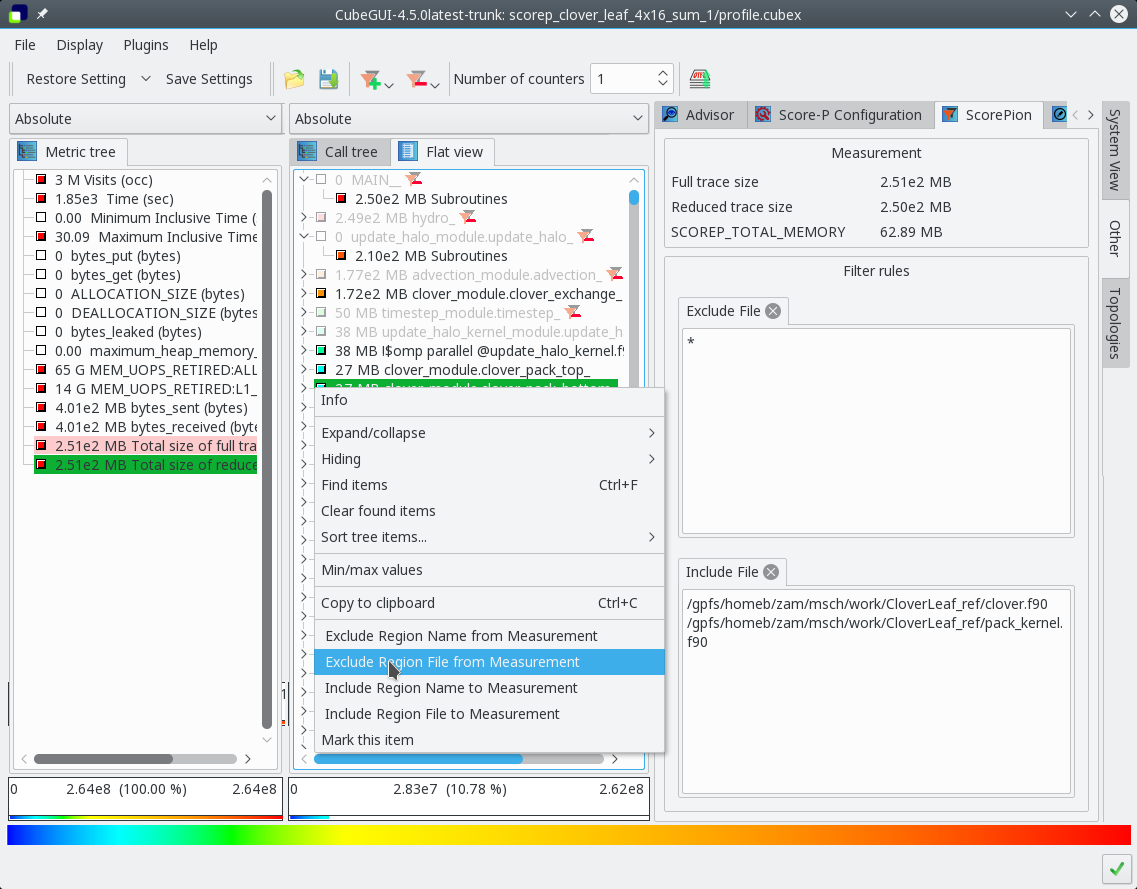
Figure 1: Creation of a measurement filter with "ScorePion" plugin.
By selecting a region with right mouse click one can choose, if this region or the region file should be included in or excluded from the measurement. A corresponding filtering rule is then created and added to the fields in the “ScorePion” window. These can also be modified manually.
In the toolbar one can set how many PAPI counters will be gathered in parallel during the measurement, as it has an impact on the memory requirements. Additionally one can add the “OTF2 trace size estimation” metrics into the analysis. The plugin then creates two derived metrics and adds them into the metric tree. One metric calculates the contribution of a call paths to the OTF2 trace (Total size of full trace). The other one (Total size of reduced trace) does same, but takes into account the filtering rules.
If these metrics are added, the plugin displays the corresponding values above the filtering rule for a better overview.
Is the user satisfied with the memory requirements, one can save the result and select either “Score-P Fiter File” or “Intel Filter File” as output format.
The plugin is also capable of reading a previously created Score-P Filter for further processing, in a case where one would like to extend an existing filter file.
One final note: the Score-P filter file is only for filtering out user functions. If the overhead comes from monitoring program paradigm functions (e.g MPI) or features (e.g. OpenMP synchronisation) other mechanisms have to be used. See the table "Score-P instrumenter option overview" in the Score-P user guide.