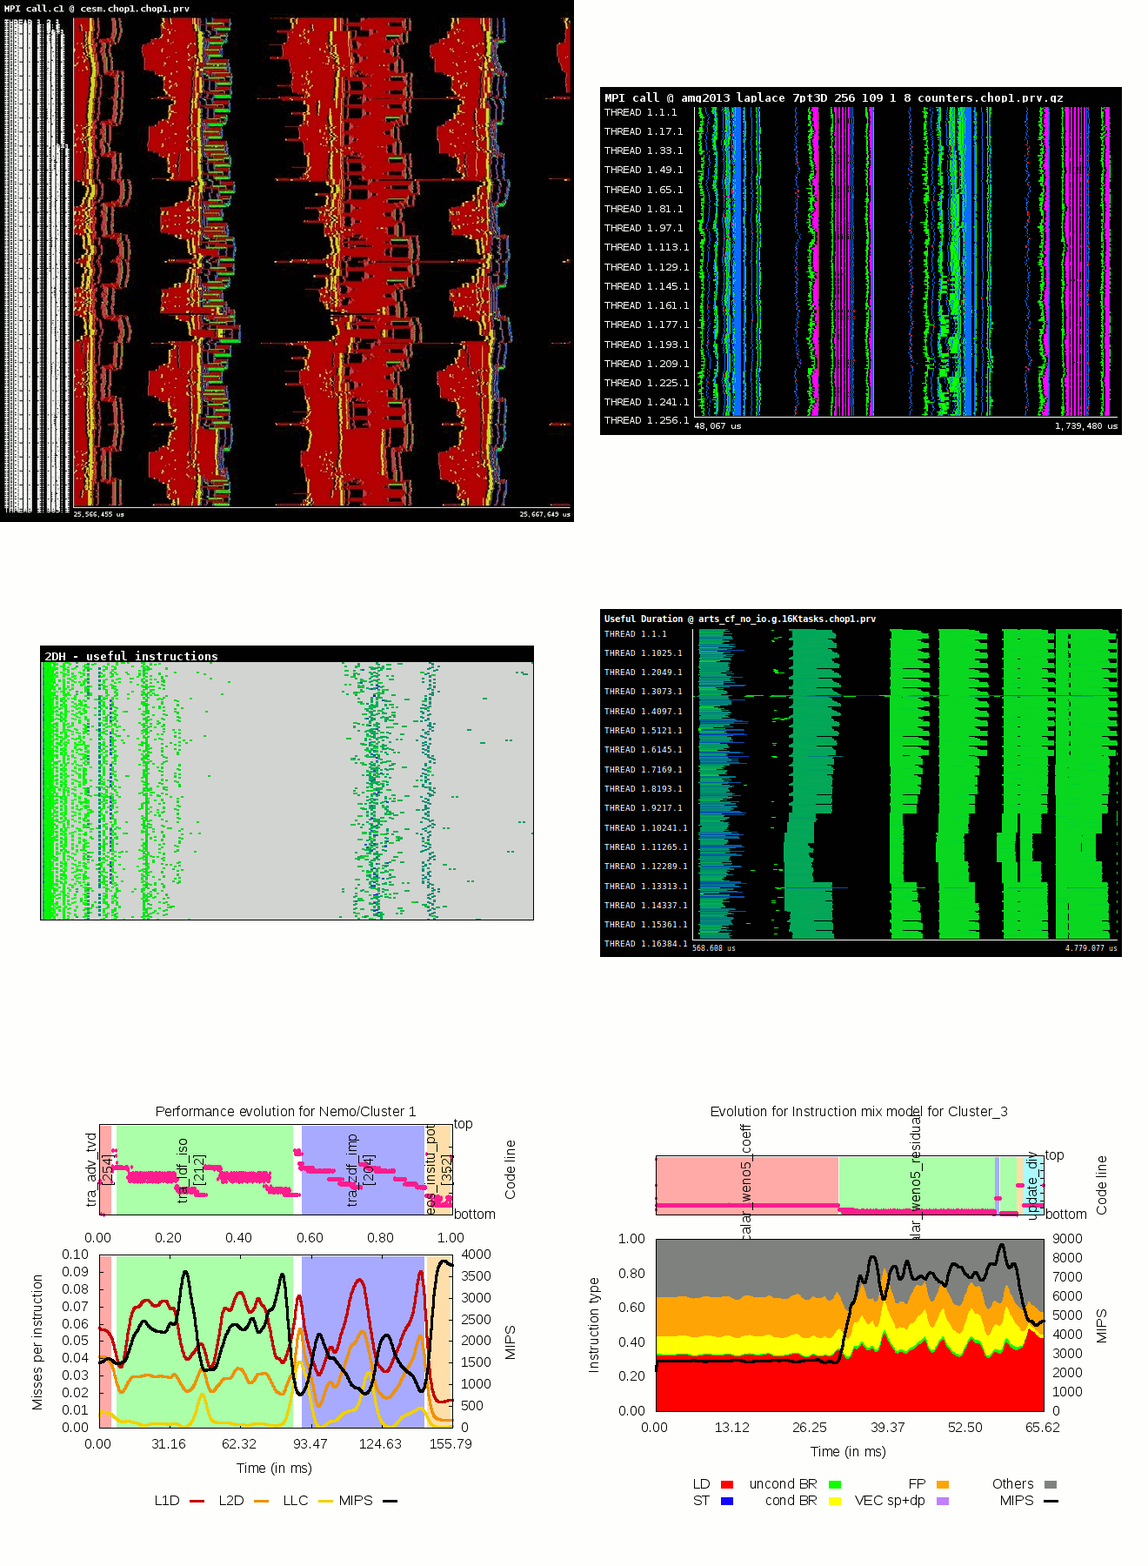
The performance analysis tools developed at BSC provide a detailed analysis that allows understanding of an application’s behaviour as well as identifying performance critical issues. They provide insight not only into the application itself but also into the underlying system.

The core tool is Paraver, a trace-based performance analyser with great flexibility to explore and extract information. Paraver provides two main visualisations: timelines that graphically display the evolution of the application over time, and tables (profiles and histograms) that provide statistical information. These two complementary views allow easy identification of computational inefficiencies such as load balancing issues, serialisations that limit scalability, cache and memory impact on the performance, and regions with generally low efficiency.
Furthermore, Paraver contains analytic modules, for example the clustering tool for semi-automatic detection of the application structure, and the tracking tool to detect where to improve code to increase scalability.
In addition, the Dimemas simulator allows a fast evaluation of what-if scenarios for message passing applications, for example to understand the benefits of moving to a machine with a faster network, or the improvements obtained if an application was better balanced.
The performance data collection is done with Extrae. Extrae intercepts the main parallel runtime environments (MPI, OpenMP, OmpSs, Pthreads, CUDA, OpenCL, SHMEM) and supports all major programming languages (C, C++, Fortran, Python, JAVA). It has been successfully ported to a wide range of platforms like Intel, Cray, BlueGene, Fujitsu Spark, MIC, ARM, and even Android. On most platforms the preload mechanism enables us to avoid specific compilations and to work with the unmodified production binary.
The performance tools from BSC are freely available as Open Source software. You can find more information at our website http://www.bsc.es/paraver or contact us via e-mail: tools@bsc.es.
