POP TensorFlow Performance Assessment
High-performance deep learning is an integral part of the HPC landscape, and POP’s expertise has been called upon recently to identify performance issues in remote sensing big data classification.
Multi-process parallelism is supported in the popular deep learning frameworks, making it possible to run machine learning over 1000s of GPUs. For example, the JUWELS Booster supercomputer features 3744 NVIDIA A100 GPUs, and cloud computing also offers access to vast resources. However, multi-process parallelism in deep learning introduces the potential for the same performance bottlenecks commonly seen in traditional HPC, making it important to assess whether GPUs are being used optimally.
A recent POP performance analysis measured parallel performance of a TensorFlow ResNet-50 network running on 48 and 64 Nvidia Tesla V100 GPUs, where Horovod with OpenMPI was used for inter-process communication. The Score-P tool was used to collect trace data, which was then analysed in Vampir. This showed good load balance of computation over the GPUs, but low GPU Parallel Efficiency, which reduced further on 64 GPUs. In both cases, the GPUs were idle for more than two thirds of the training. The assessment recommended reducing GPU idle time by adding workers to the image generator to supply pre-processed batched data to the GPU.
Understanding GPU efficiency in High-Performance Deep Learning
When using expensive hardware for deep learning it is important to understand whether good use is being made of the GPU resources, and to question whether the GPU Parallel Efficiency can be improved. As for any parallel computation, inefficiencies can arise due to imbalanced computation, excessive time in data transfer, and idle time due to synchronisation. A POP Performance Assessment can help answer these questions about efficiency.
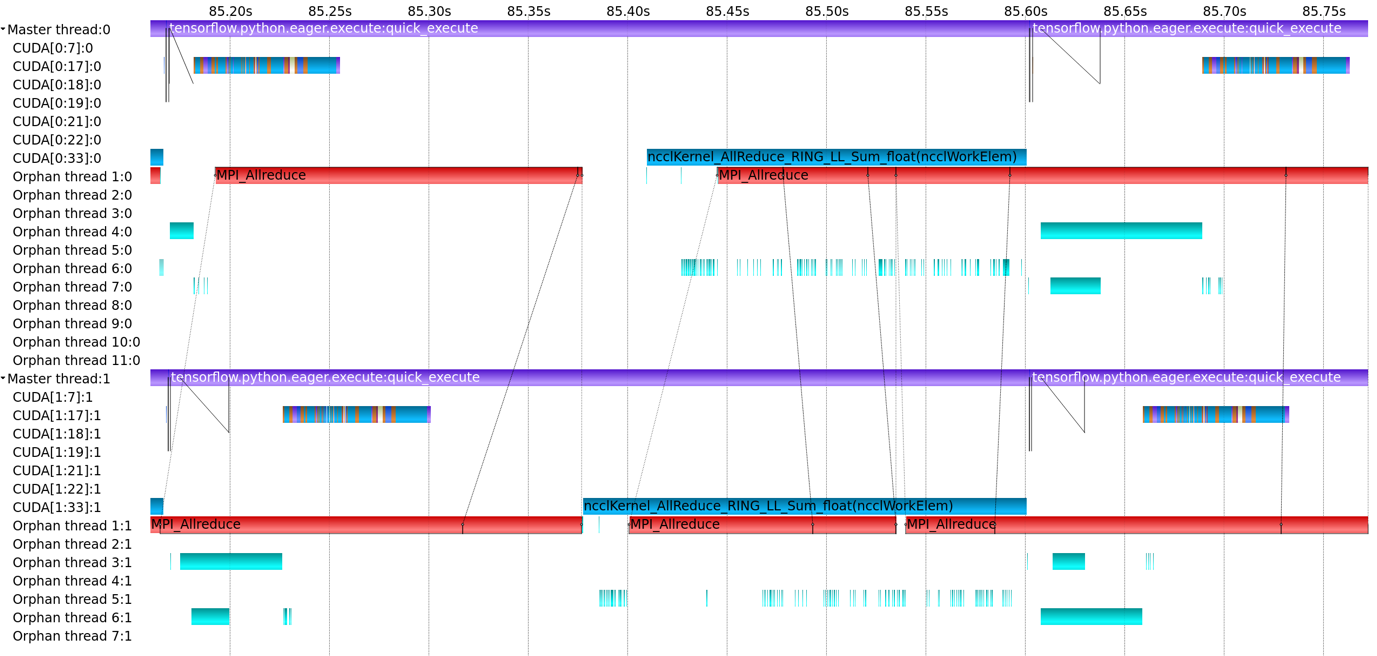
In a POP Performance Assessment, GPU and CPU activity can be captured by the Score-P V6.0 measurement system via its Python bindings, then viewed and analysed using Vampir or Cube. For example, the image below shows a 0.6s region of the Score-P trace viewed in Vampir, showing ncclAllReduce communication calls on the GPU and MPI_Allreduce calls on the CPU. In this example, parallel scaling was good, with x14.4 speedup on 16 GPUs relative to one GPU. However, the time spent in kernel computation is low, 34% of the run time on one GPU, dropping to 30% on 16 GPUs.
If you’re using High-Performance Deep Learning and want a free POP assessment to help quantify performance and efficiency, please apply at https://pop-coe.eu/request-service-form.