Mostly, our clients want help improving MPI parallelisation, perhaps coupled with OpenMP or CUDA, or something more exotic, but from time to time, we are asked to improve pure OpenMP code. A recent ‘proof of concept’ study demonstrated the power of our metrics-based approach for understanding parallel performance issues and for interpreting improvements in performance after code optimisation.
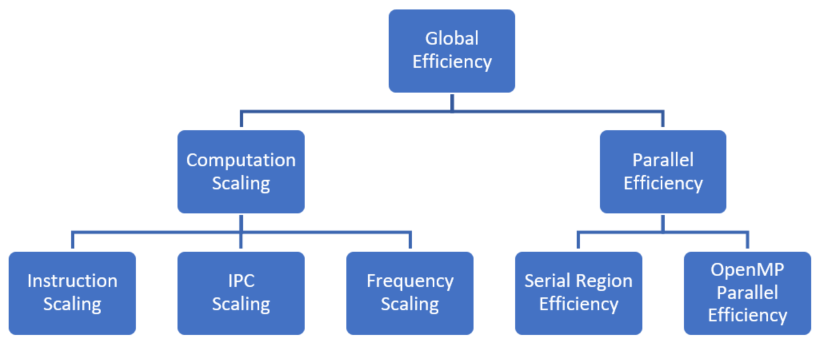
Fig 1. POP OpenMP Metrics Hierarchy
POP OpenMP metrics were calculated during a POP assessment and identified three sources of inefficiency. Reducing IPC caused the time in useful computation to double going from 1 to 45 threads. In addition, the metrics showed 30% of the run time was due to inefficiency within OpenMP regions, and 15% was due to serial computation outside OpenMP. By calculating POP metrics for each of the 129 OpenMP regions, it was shown that only four regions were contributing to the inefficiency, in all four due to load imbalance. This shows the power of the POP metrics in being able to quickly identify the causes of poor performance.
 The inefficiency due to serial execution and imbalance was easily fixed by adding more OpenMP parallelisation and using loop collapsing.
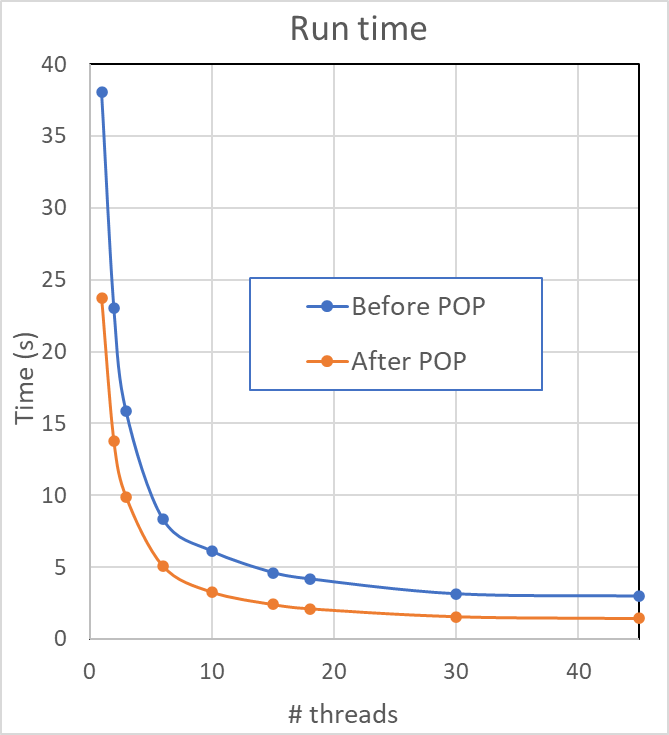
Additional work to improve the IPC scaling was undertaken by POP as part of a ‘proof of concept’ study, resulting in a new code that ran in half the time on 45 threads. POP metrics were used to analyse this improved performance, showing useful instruction count was reduced to 0.6 that of the original, with IPC improved by 1.5 times.
Another success for POP!
-- Jonathan Boyle (NAG)