Last June we published a review of the first 9 months of the POP project on the NAG Blog http://blog.nag.com/2016_06_01_archive.html, which looked at some statistics about the assessments undertaken by the project so far. Now that we have completed 18 months of the project it seemed like a good time to revisit the earlier review and look at how things have developed as the project has progressed.
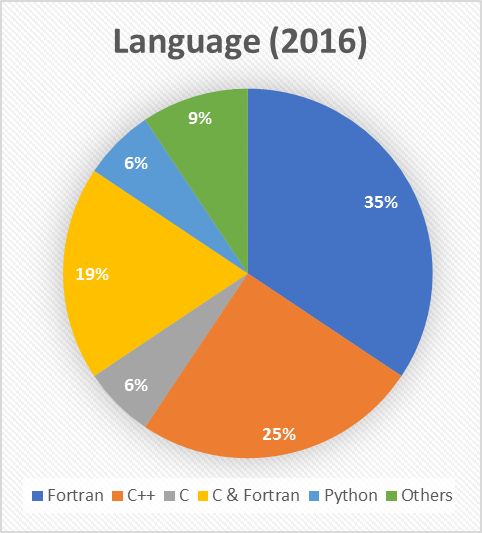
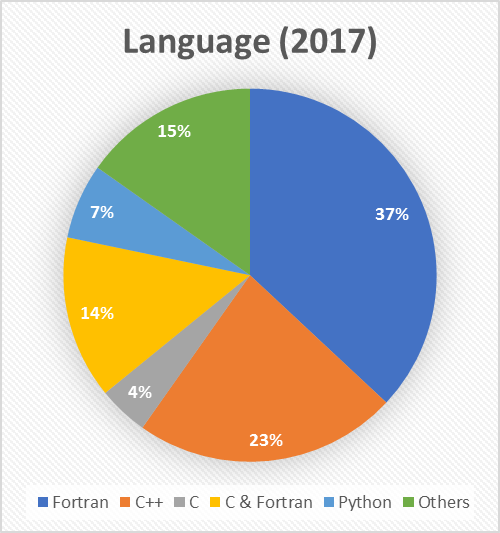
9 months ago, the predominant language that the assessed codes were written in was Fortran. Today, this is unchanged – in fact, the breakdown across the board is almost identical, down to the actual percentages of each language observed.
|
|
|
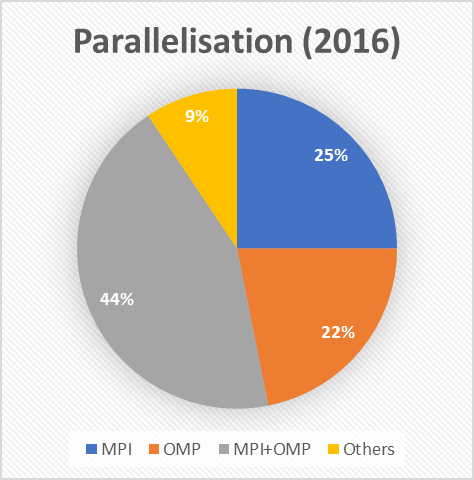
What has changed is the distribution of the ways in which the codes are parallelised. In the earlier review, we saw that nearly half (44%) of the codes that POP had looked at used a hybrid approach that combined MPI and OpenMP. Today hybrid codes only make up 28% of all those analysed, and the most common form of parallelisation is MPI by itself.
|
|
|
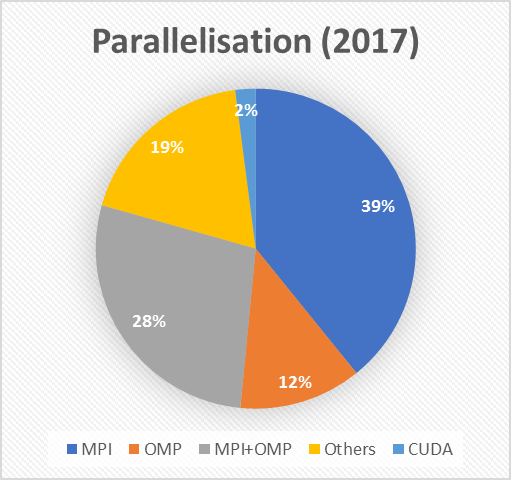
This might be an example of “reversion to the mean” in action: we have now analysed twice as many codes as we had 9 months ago, so the proportion we observe that have a hybrid approach may now more closely reflect how common such codes are. Alternatively (or perhaps additionally), we previously theorised that POP had seen a lot of hybrid codes because they are difficult to get performing well. It could be that POP initially appealed to this narrow audience, but in the intervening 9 months we have widened our focus and become more well-known in the wider HPC community.
We have made some changes to the way in which we break down the POP assessments by sector/subject area since June 2016. Here is the old data:
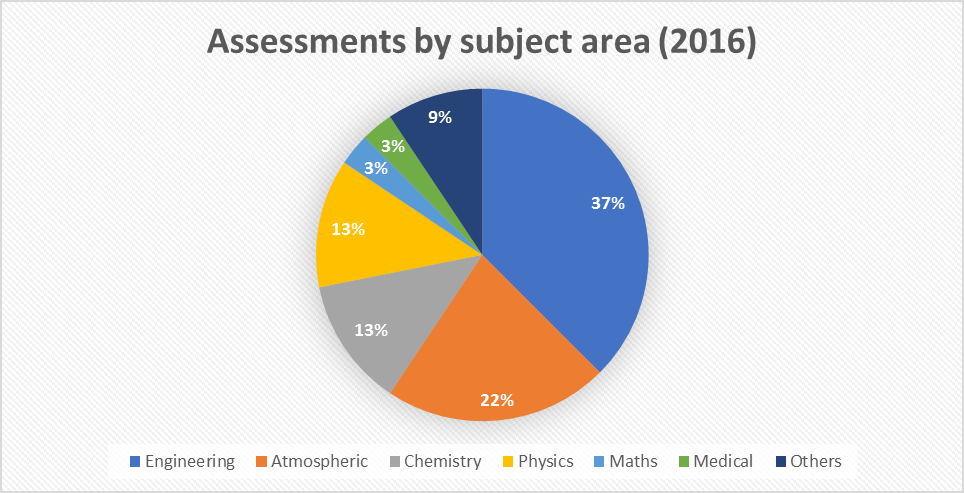
To provide more granularity about the science that POP has helped to make more efficient, we have redefined how we classify the codes. We split the old “Engineering” category into “Engineering” and “CFD”, and the new “Computational Chemistry” sector contains many of the codes that were previously classed as either “Chemistry” or “Physics”. Although this redefinition makes direct comparison somewhat tricky, we do not observe a noticeable difference between distribution of codes analysed from 9 months ago.
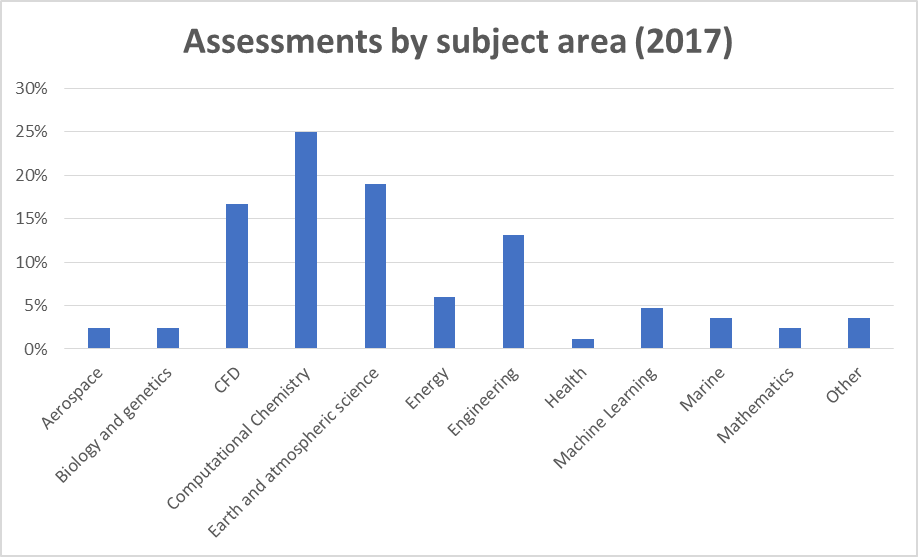
Given the extra categories compared with 2016, it is clearer to plot the 2017 data as a bar chart. “Computational Chemistry” codes make up 25% of our assessments, which is in-line with the combined 26% for “Physics” and “Chemistry” codes in 2016. Engineering has shown a slight drop over the same period (from 37% to 30%, if “CFD” and “Engineering” are combined), but this has been balanced by a growth in assessments from other areas not represented in 2016, such as “Energy” and “Machine Learning”. POP has successfully broadened its appeal to wider audiences beyond traditional HPC users.
Looking where the codes that POP has analysed have come from, we see that, as before, Germany and the UK dominate.
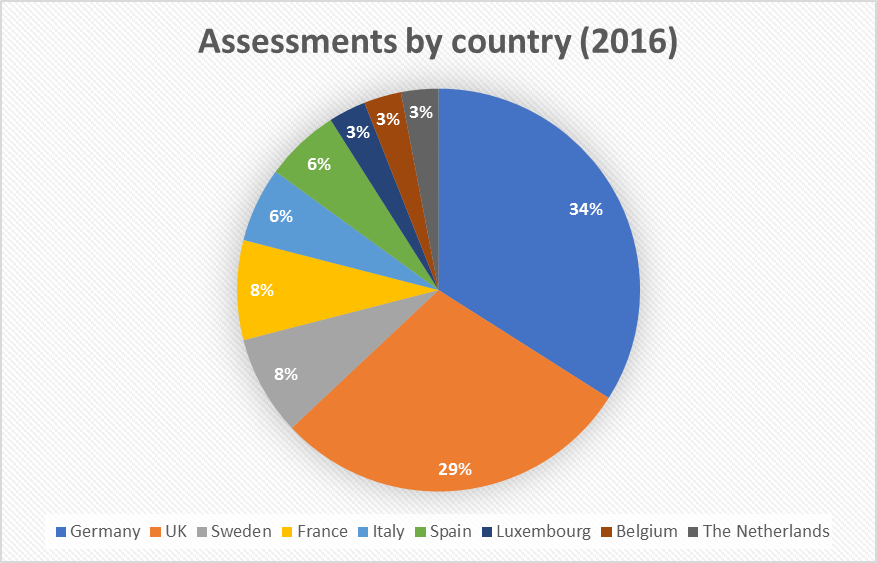
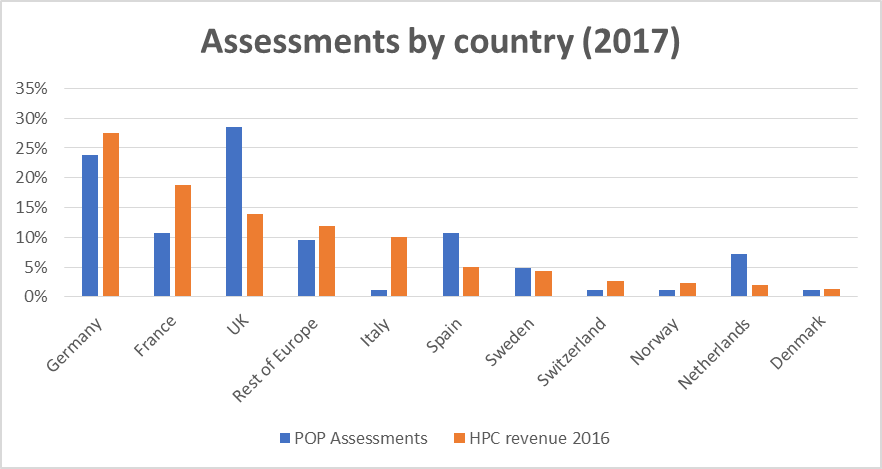
As we noted in the earlier review, this may be because 3 of the POP partners are based in Germany and NAG, which leads the business development efforts, is based in the UK. To judge how much this is a factor, we compare the percentage of POP assessments against the size of the HPC market in every European country.[1] We see that Germany is the largest HPC market on the continent, which explains why it has such a large share of POP assessments, and that the UK is somewhat over-represented, which we attribute to the presence of NAG. We also see that Spain is also over-represented, which may not be surprising as the coordinators of the POP project are based in Barcelona. The popularity of POP in the Netherlands is largely because we have one customer there who has submitted several codes for assessment (see the success stories from SCM on our website https://pop-coe.eu/target-customers/success-stories).
Looking back over the past 9 months, we see that some things have remained the same (e.g. the preponderance of Fortran codes) and some things have changed (e.g. a lower proportion of hybrid MPI+OpenMPI codes). One goal we set ourselves last time was to reach out to more subject areas and EU countries, and it looks like we have made good progress here. There is still room for improvement, however: certain countries remain under-represented versus the size of their HPC market, for example France and Italy. This gives us a good indication of where we need to focus our efforts in the final year of the project.
[1] The data comes from the open SMART 201/0021 dataset, which can be found at http://ec.europa.eu/newsroom/dae/document.cfm?doc_id=10763