Welcome to the seventh newsletter from the EU POP Centre of Excellence. Our free-of-charge services to help EU organisations improve the performance of parallel software.
This issue includes:
- POP Webinars - Using OpenMP Tasking on Monday 4th December 2017 14:00 GMT and Parallel I/O Profiling Using Darshan on Thursday 1st February 2018;
- POP’s Jesus Labarta wins ACM and IEEE Computer Society award;
- Success story - 25% faster time-to-solution for urban microclimate simulations;
- Vampir Client-Server Model for large trace files;
- Lightweight MPI Profiling;
- Addressing Load Balance Issues;
- POP at upcoming events.
For information on our services and past editions of the newsletter see the POP website.
POP Webinar – Using OpenMP Tasking
Monday 4th December 2017 - 14:00 GMT | 15:00 CET
With the increasing prevalence of multi-core processors, shared-memory programming models are essential. OpenMP is a popular, portable, widely supported and easy-to-use shared-memory parallel model. Since version 3.0, released in 2008, OpenMP offers tasking to support the creation of composable parallel software blocks and the parallelization of irregular algorithms. However, the tasking concept requires a change in the way developers reason about the structure of their code and hence expose the parallelism of it. In this webinar, we will give an overview about the OpenMP tasking language features and performance aspects, such as introducing cut-off mechanisms and exploiting task dependencies.
Click here for more information and to register for the Using OpenMP Tasking webinar.
POP Webinar - Parallel I/O Profiling Using Darshan
Thursday 1st February 2018 - 14:00 GMT | 15:00 CET
HPC applications have a need for persistent storage for reading initial conditions, writing the final solution, and checkpointing. Checkpointing frequency increases with larger scale simulations due to the increased risk of node failure. This subsequently increases the load of the I/O subsystem and the Darshan profiling tool has been developed to help code developers understand their application’s I/O characteristics. The HPC workload characteristics can then be used to help code developers optimise the I/O of their applications and increase data throughput. This information can also help HPC system administrators configure parallel storage systems to better support the HPC user community.
Click here for more information and registration.
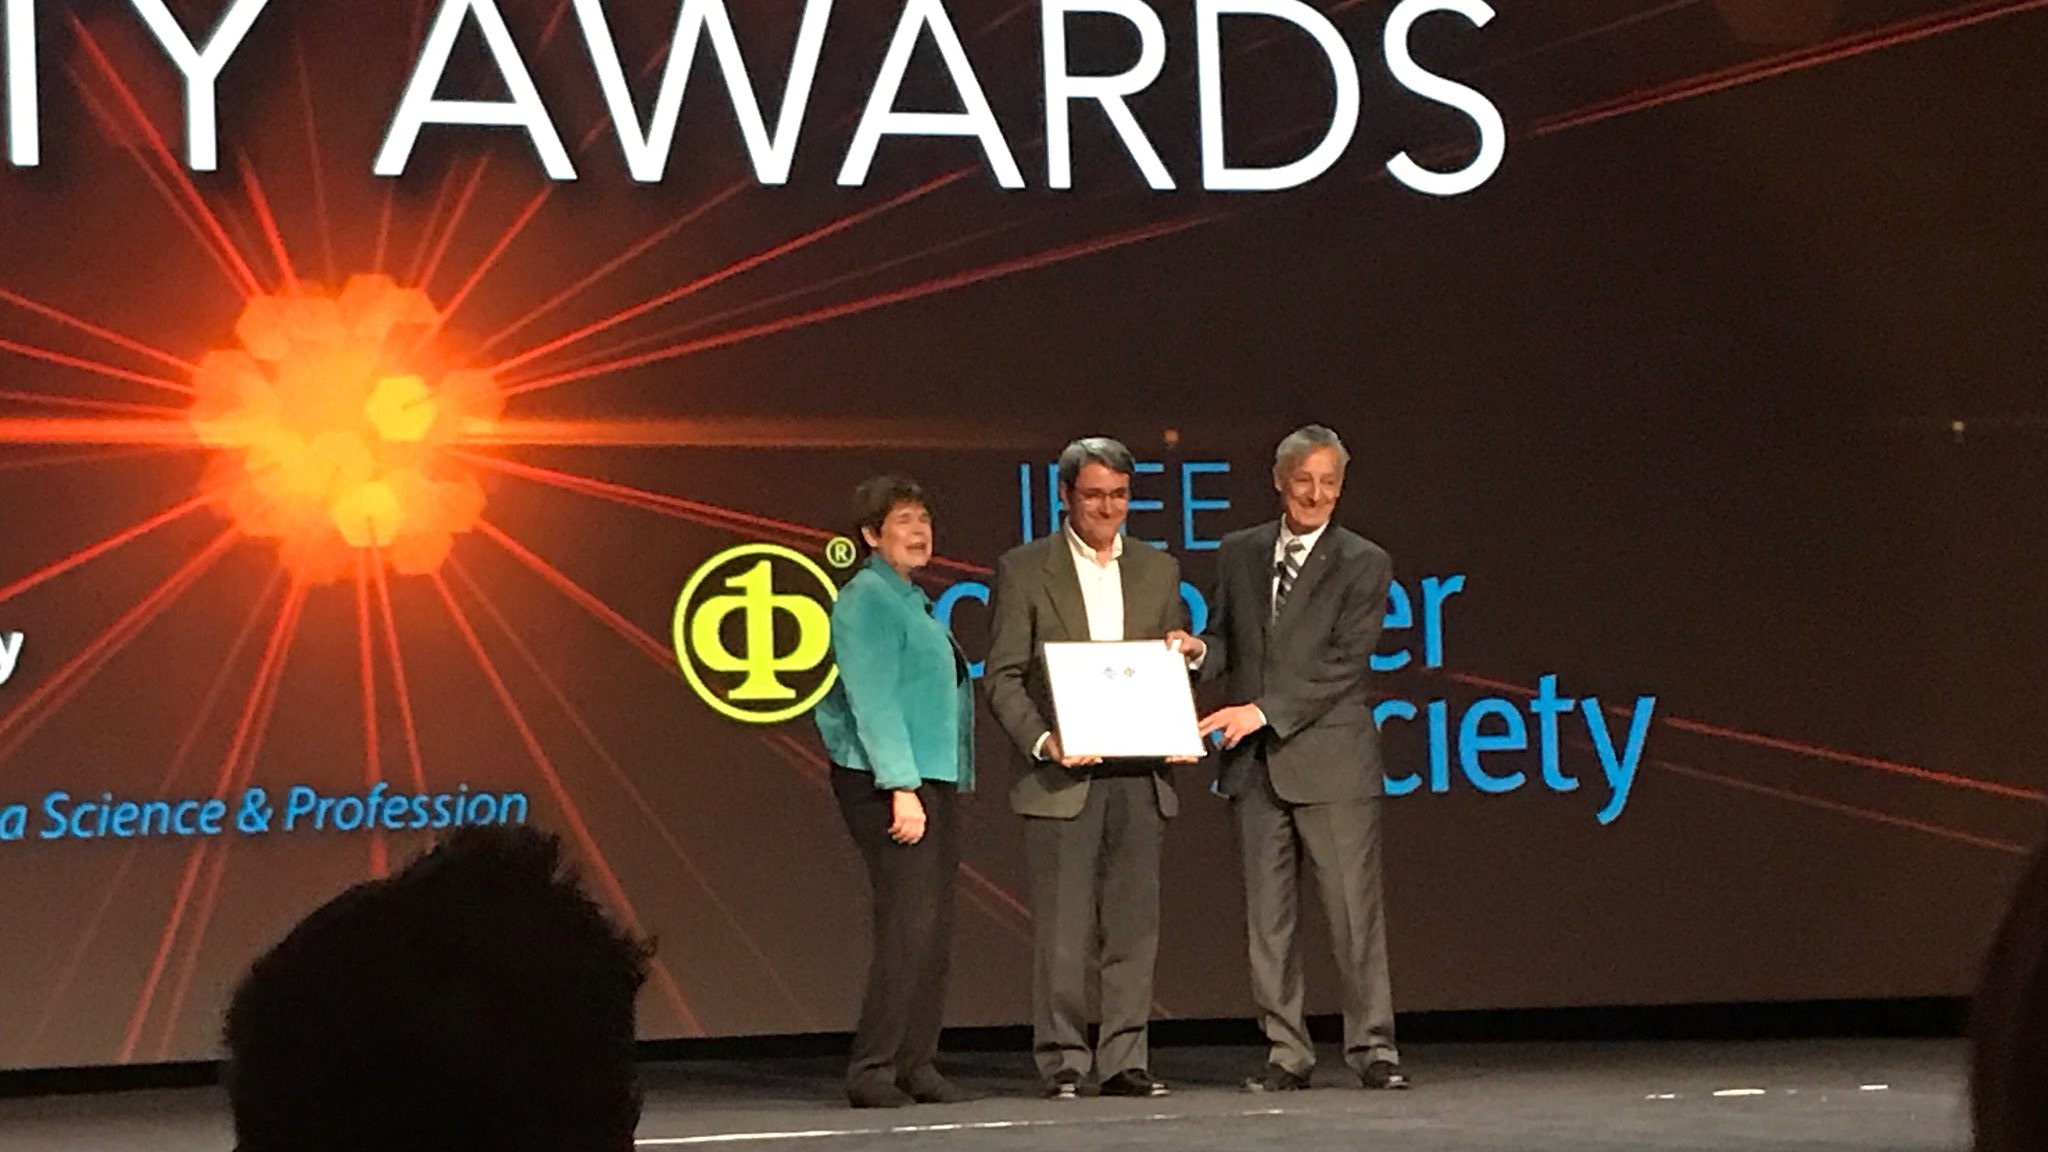
POP Lead Jesus Labarta wins ACM and IEEE Computer Society Award
POP lead Jesus Labarta wins the prestigious 2017 ACM/IEEE-CS Ken Kennedy award for his contributions to programming models and performance analysis tools for high performance computing. This makes Labarta the first European recipient of the award. The award was presented to him at the Supercomputing 2017 (SC17) conference which was held in Denver, Colorado. Labarta’s team develop the open-source Paraver/Extrae profiling tools which have been widely used at POP to discover insights into performance issues of parallel applications. Below is a picture of Labarta receiving his award at SC17:
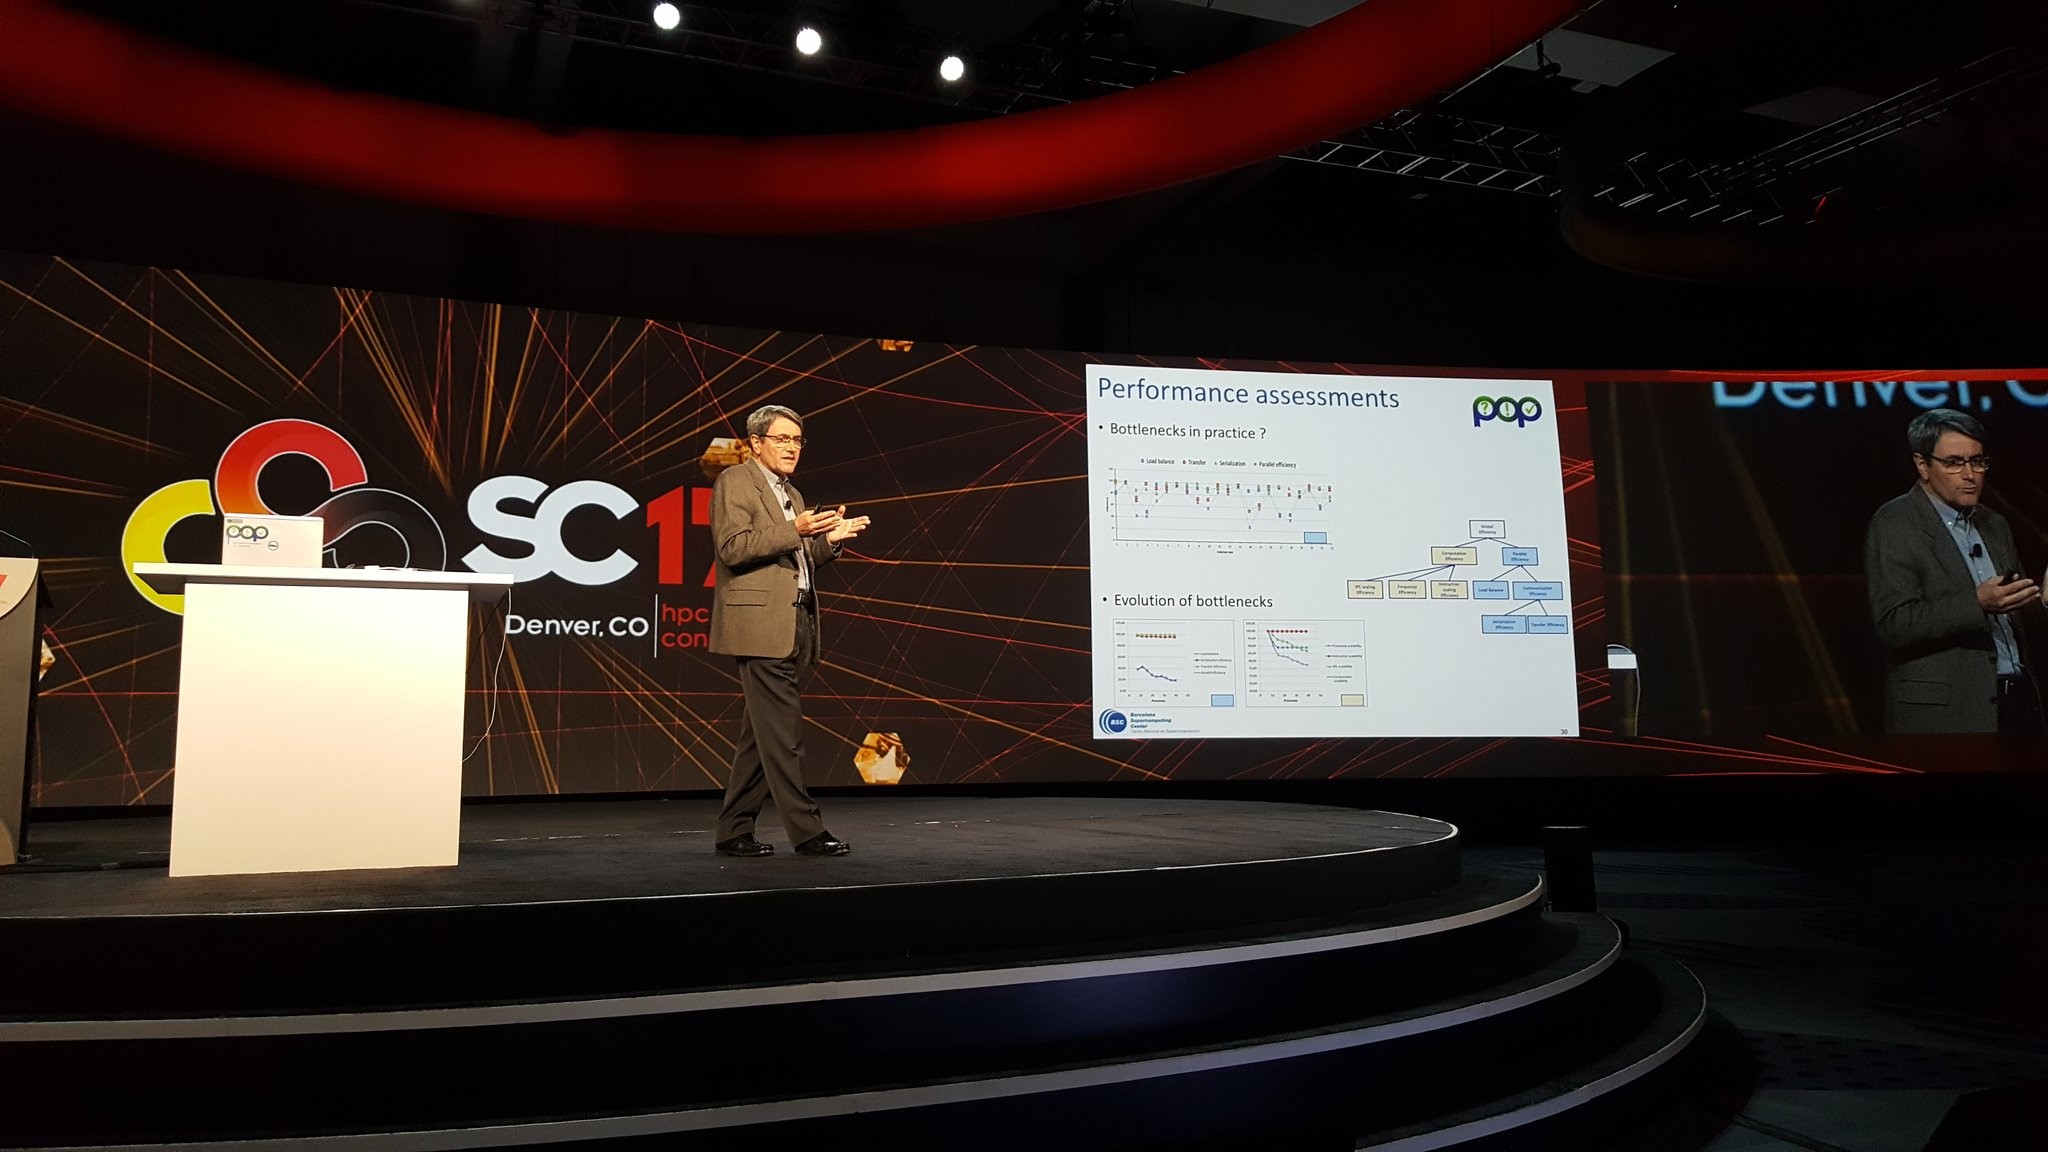
Below is a picture of Labarta presenting the POP project at SC17:
For more information about this award, see https://www.computer.org/web/pressroom/kennedy-award-2017 and http://awards.acm.org/kennedy.
Success Story - 25% Faster Time-To-Solution Urban Microclimate Simulations
Rheologic is an Austrian company providing CFD (Computational Fluid Dynamics) services and solutions for complex flows. Rheologic develop solvers for the OpenFOAM framework and the POP project analysed their uhiSolver (Urban Heat Island Solver). This is a program to forecast local conditions (e.g. thermal comfort) during the hottest days of summer in densely built urban areas including the cooling effects of plants and water surfaces due to evaporation.
uhiSolver calculates and models air-flow with day/night cycles, sun movement across the sky including direct and diffuse radiation as well as reflections, different surfaces’ albedos, buoyancy effects in air flow and evaporative cooling. It is written in C++ and parallelised using MPI. For further information on this case study, please see:
Vampir Client-Server Model
When analysing large scale runs of parallel applications, trace files can sometimes be very large in size making them difficult and time consuming to load into the tool and visualise the performance characteristics interactively. The machine where the visualisation is being done might not have sufficient memory to load the entire trace file, and interactive visualisation of large trace files can be sluggish. To reduce the trace file size, some events are filtered out or the runtime of the application is reduced. However, there may be occasions where reducing the size of the trace file is not possible because all the events are of interest and the entire execution is also of interest.
To address this issue, the Vampir tool (https://www.vampir.eu/) has a client-server distributed memory architecture. This runs a number of servers on separate compute nodes which read the trace file in parallel and client front end which visualises the data. Vampir uses Score-P for tracing application runs which stores the trace data in the OTF2 trace format which is the same format used by Scalasca. For a recent POP audit, a 1,000 MPI process run created a 1GB trace file and a 12,000 MPI process run created a 40GB trace file. Interactive visualisation of the trace files required 21 compute nodes.
To launch the k Vampir server on m compute nodes, type:
$ vampirserver up -n k -N m
Launching VampirServer...
Running k analysis processes... (abort with vampirserver stop 11522)
VampirServer <11522> listens on: cn14:30003
The above invocation of Vampir server shows that it is listening on compute node cn14 and port 30003. These values may vary and are required for the Vampir client. Also note that it has allocated a unique number for the session ID which is 11522 for the above example. Launch the Vampir client on your desktop by simply typing vampir which will launch the GUI front end. Click on the option to open a new trace file and select Remote File. In the Open Remote dialogue box, put the server name as cn14 and port number 30003 which is for this example - replace these details for your session. Click on Connect and navigate to the directory location where the OTF2 trace files resides.
After completing the analysis, stop the Vampir server using the command:
vampirserver stop 11522
The session ID 11522 is for this example – replace the session ID for your analysis session.
Lightweight MPI Profiling
HPC codes can spend time in three phases: computation, communication and file I/O. Tools such as Paraver and Scalasca analyse all three phases. There may be situations where the code developer may only be interested in the communication aspects of the code, therefore only the MPI communication aspects need to be profiled. For this, there are two options: Intel MPI’s internal profiling capability [1] and mpiP [2], both of which are lightweight.
Intel MPI
To use Intel MPI’s profiling capabilities, set the I_MPI_STATS environment variable to one of the values 1, 2, 3, 4, 10 or 20. The higher the value, the more information that will be provided. Then set the filename that should store the performance report using the environment variable I_MPI_STATS_FILE, e.g. prof.dat. Then run the MPI code as normal using mpirun. When the code has completed running, the performance report should be contained in the specified file, e.g. prof.dat. This report contains the following:
- Amount of data transferred between MPI processes;
- Amount of data transferred by MPI subroutines;
- Amount of data transferred between MPI processes and by which MPI subroutine;
- Performance details of MPI collective subroutines.
Regions of interest in code can be enclosed with MPI_PCONTROL to switch on/off profiling. More information on Intel MPI’s profiling capabilities can be found at:
https://pop-coe.eu/further-information/learning-material/profilingimpi
mpiP Profiling Library
mpiP [2] is another lightweight way of profiling MPI and is open-source. It uses statistical sampling to record performance data making it very lightweight. The code has to be compiled with the -g flag and linked with the mpiP library. The link line is shown below and should be in the far-right of the link line:
-o app.exe -L<path to mpiP>/lib -lmpiP -lm -lbfd -liberty -lunwind
The code is then executed as normal with mpirun and the performance report is printed to a file (the filename is printed at the end of the application run). The performance report contains the following sections:
- The percentage of time each rank is spending in MPI (which includes MPI-IO) and non-MPI;
- Call sites, which are locations in the code which contain MPI calls;
- The top 20 call sites that spend the most time in MPI;
- The top 20 calls sites that send the most data;
- MPI call site statistics which include number of times called, average/max/min time spent, and percentage of time in code and communication;
- MPI call site statistics which include number of bytes sent, and average/max/min/total bytes sent.
Regions of interest in code can be enclosed with MPI_PCONTROL to switch on/off profiling. For further information on mpiP, please see reference:
https://pop-coe.eu/further-information/learning-material/profilingmpip
Addressing Load Balance Issues
Load balance issues are one of the most commonly encountered inefficiencies in the POP project. This is calculated as the ratio of the average time a process/thread in computation to the maximum time. To investigate load imbalance further:
- Check whether the load imbalance occurs in a certain region of the code. As with investigating any performance issue, it is a good idea to narrow down the issue;
- Check if one thread/process is much slower than the rest of the team. It could be that one process is doing a specific task such as I/O;
- Check whether the load balance changed over time or if it is constant;
- Check the processes/threads execute different number of instructions which are stored in the PAPI_TOT_INS counter. If they are roughly the same, then check whether the IPC (= PAPI_TOT_INS / PAPI_TOT_CYC) varies;
To resolve load imbalance, the following are suggestions:
- If there are regions of code that are executed by a single thread/process, investigate whether they can be parallelised. This commonly occurs when file I/O occurs where one thread/process is responsible for this. If the number of processes divided by the file size is sufficiently large, then investigate parallelising the file I/O;
- If processes/threads perform different number of instructions, then explore a better parallel decomposition;
- If IPC varies, it could be that cache usage varies. This may be alleviated by spreading the threads/processes across the CPU socket using thread pinning techniques;
- Use dynamic work distribution. This is easily achieved in OpenMP by using the schedule key work when declaring OpenMP parallel loops;
- If dynamic work distribution is already being used, consider varying the chunk size which is the size of the work each thread is responsible for.
Hands-on Workshop on HPC Performance Analysis
11-14 December 2017, at Maison de la Simulation near Paris
The two centres of excellence in computer applications EoCoE and POP will hold a hands-on workshop on HPC benchmarking and performance analysis from 11-14 December 2017, at Maison de la Simulation near Paris, this time supported by the French PATC.
This workshop is especially designed to welcome engineers/researchers from the industry who are developing and/or using their own parallel numerical codes. They will be able to apply a unique performance analysis methodology to their application to permit seamless monitoring of over 20 performance indicators. Tools and results from the workshop can be taken back home in order to benchmark future software modifications in a reproducible manner, allowing very significant productivity improvement during the development and optimization phase. Participants will also have ample time to meet and discuss with HPC experts from the EoCoE and POP projects to seek expertise on special issues or to eventually engage into further collaboration.
More detailed information: http://www.eocoe.eu/events/performance-evaluation-workshop-mdls
Registration: https://events.prace-ri.eu/event/666
POP Presentation at Computing Insight UK (CIUK) conference in Manchester on 12-13 December 2017
Not Only Fortran and MPI: The Performance Optimisation and Productivity Centre of Excellence's View of HPC Software in Europe
In two years of operation, POP has completed approximately 100 investigations of codes drawn from a wide range of scientific domains. In this talk we will share our view of how we see people writing and using HPC software - in our experience it's not all Fortran and MPI! We will look at the technical distribution of applications investigated by POP, including which programming languages are used and how the codes are parallelised, as well as which types of science that they support. We will also draw out some common performance issues identified by the analyses and highlight some of the challenges we have had to overcome, ranging from technical issues with analysis tools to how best to engage with potential users of the service.
We will highlight the types of improvements that POP's users have been able to achieve as a result of engaging with the project. POP's success stories include a CFD code, for which the user reported substantial performance improvement, and a micro-structure simulation code, where a 10x speedup in the key computational region was achieved. To register for the CIUK conference, please see:
Apply for free code optimisation help
POP have now reached the target number of parallel applications to profile. However, we still encourage applications to use the POP service but the performance analysis will take longer than usual as we have limited resources available. If you have a request and would like to know about timelines, please email us to discuss this further.
We offer a range of free services designed to help EU organisations improve the performance of parallel software. If you’re not getting the performance you need from parallel software, please apply for help via the short Service Request Form, or email us to discuss further.
The POP Helpdesk
Past and present POP users are eligible to use our email helpdesk (pop-helpdesk@bsc.es). Please contact our team of experts for help analysing code changes, to discuss your next steps, and to ask questions about your parallel performance optimisation.