Welcome to the tenth newsletter from the EU POP Centre of Excellence. For new requests, please see section “Apply for free help with Code Optimisation” at the bottom of this newsletter.
This issue includes:
- POP Webinar - 3x Speed Improvement for Zenotech's zCFD Solver on 12 March 2019 2pm GMT | 3pm CET;
- Profiling Python codes using Extrae;
- SMEs that have benefitted from the POP service:
- Shearwater Reveal - 44% runtime reduction;
- 25% Faster time-to-solution for Urban Microclimate Simulations for Rheologic;
- 2x performance improvement for SCM ADF code.
- Apply for free help with code optimisation;
- The POP Helpdesk.
For information on our services and past editions of the newsletter see the POP website.
POP Webinar - 3x Speed Improvement for Zenotech's zCFD Solver
12 March 2019 2pm GMT | 3pm CET
zCFD by Zenotech is a density based finite volume and discontinuous Galerkin computational fluid dynamics (CFD) solver for steady-state or time-dependent flow simulation. It decomposes domains using unstructured meshes. It is written in Python and C++ and parallelised with OpenMP and MPI.
This webinar will describe the work that POP and Zenotech undertook to investigate the performance of zCFD. An initial Performance Audit using Intel's VTune Amplifier performance profiler identified several areas of potential improvement, which Zenotech went on to address in a POP Proof-of-Concept (PoC) study. As a result of the PoC, zCFD ran 3x faster on a representative input case.
In this 30-minute live webinar, we will describe:
- An introduction to POP's performance analysis methodology;
- How Intel VTune was used to gain performance insights;
- The modifications made to zCFD as a result.
Click here to register or for more information.
Profiling Python Codes using Extrae
The use of Python is becoming popular for HPC code developers and its benefits include quicker development times and the availability of numerous numerical and other libraries. Many Python HPC codes also use components written in compiled languages such as C, C++ and Fortran for performance reasons, whilst taking advantage of the relative ease of programming in Python.
Python offers two approaches to implementing parallel codes:
- using MPI through the MPI4PY module;
- using the Python multiprocessing module.
Three years ago, the performance tool developers at BSC extended the instrumentation feature of Extrae to support Python codes [1]. Here we give a brief overview of using MPI4PY.
The Extrae instrumentation library needs to be pre-loaded using the LD_PRELOAD environment variable, before the application execution to capture the MPI calls and generate the Paraver trace file. The code is executed in the usual manner but with an additional script prefixed as shown below in boldface:
$ mpirun -n 64 ./trace.sh python my_program.pywhere the script
export PYTHONPATH=$EXTRAE_HOME/libexec:$PYTHONPATH
export EXTRAE_CONFIG_FILE=./extrae.xml
export LD_PRELOAD=$EXTRAE_HOME/lib/libmpitrace.so
$*
The environment variable EXTRAE_HOME points to the Extrae installation root directory. This works for Python codes, as well as when MPI is also called from within a C, C++ or Fortran code. The obvious benefit is that no code changes are required - simply set up the environment as shown above in your job submission script.
In addition to profiling MPI, Extrae is also able to instrument the execution of Python functions by using one of the Python profilers. The Python main program needs to import the Extrae module for profiling code using MPI4PY as shown below:
import pyextrae.mpi as pyextrae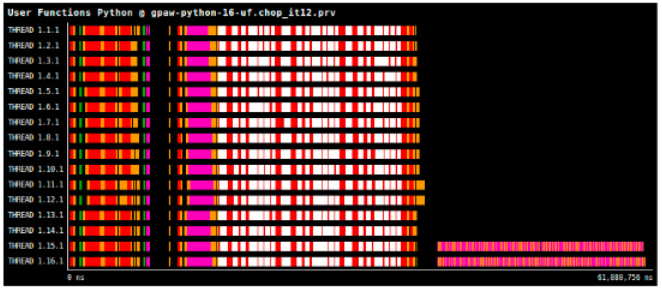 The list of functions that require profiling is listed in the XML file pointed to by the
 EXTRAE_CONFIG_FILE environment variable, i.e. extrae.xml in this case. This is specified in the user-functions XML tag which points to a text file containing the names of the functions to be instrumented. An example Paraver snapshot of Python user functions is shown on the right.
Extrae also supports the Process class of the multiprocessing module. Using the Python profiler, Extrae intercepts the calls that create new processes and starts its instrumentation. BSC plans to extend the support to the Pool class.
[1] “Performance Analysis of Parallel Python Applications”, M. Wagner, et al. Procedia Computer Science, Volume 108, 2017, Pages 2171-2179.
SMEs that have benefitted from the POP service
One of the aims of the POP service is to help small to medium size enterprises (SMEs) improve their productivity by increasing the performance of their parallel applications. This is to help the EU become economically competitive. In addition, the service aims to advance knowledge and skills in profiling and optimisation for SMEs.
Shearwater Reveal - 44% runtime reduction
Shearwater Reveal is a seismic processing code that does time and depth analysis for land and maritime applications. Shearwater Reveal land processing tools cover all aspects of land processing from refraction statistics to final time and depth imaging.
POP performance assessments located inefficiencies in the most computationally intensive OpenMP region to a critical section which is protecting file read/write operations from race conditions. A POP proof-of-concept was undertaken to remove the need for this critical section and assess the potential gains that could be achieved. The proof-of-concept identified that file I/O inside the critical section was hindering the code’s performance significantly and the following recommendations were made to improve this:
- Reduce file I/O where possible by improving re-use of data;
- Remove file I/O from computationally intensive loops;
- Combine file I/O to improve the writing performance as large single reads/writes to file are more efficient that multiple small reads/writes;
- Implement dynamic load balancing which improved the load balance efficiency to close to 100%;
- A small section of serial code was identified for potential parallelisation.
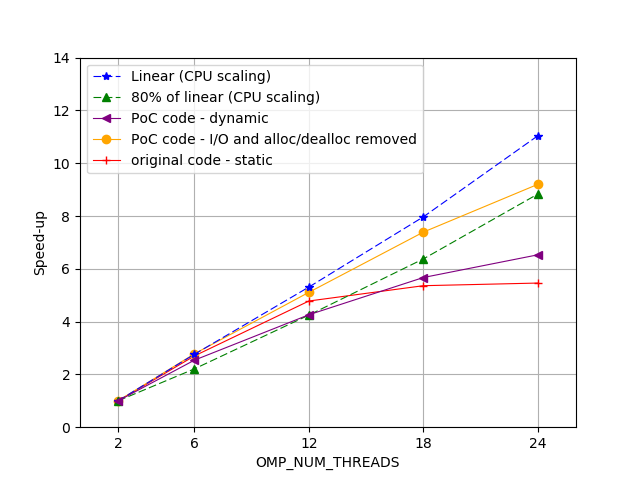
The modified code with all I/O and memory allocation/deallocation removed (yellow line) from the region of interest shows a performance gain of 44% when compared to the original.
Changes were made based on our analysis and for a full-scale production run the computational cost was close to halved.
25% Faster time-to-solution for Urban Microclimate Simulations for Rheologic
Rheologic is an Austrian company providing CFD (Computational Fluid Dynamics) services and solutions for complex flows.
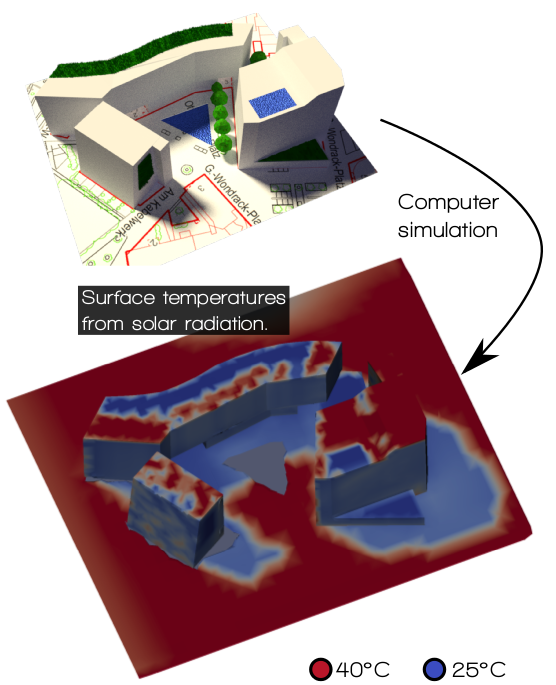 Rheologic develop new solvers for the OpenFOAM framework and have developed the uhiSolver (Urban Heat Island Solver). This is a program to forecast local conditions (e.g. thermal comfort) during the hottest days of summer in densely built urban areas taking into account the cooling effects of plants and water surfaces due to evaporation.
uhiSolver calculates and models air-flow with day/night cycles, the sun’s movement across the sky including direct and diffuse radiation as well as reflections, different surfaces’ albedos, buoyancy effects in air flow and evaporative cooling. It is written in C++ and parallelised using MPI.
We found that the performance was already very good showing super-linear speedup. However, using the POP methodology we identified room for improving the load balance of the application to further boost the performance. The load imbalance was found to be due to varying Instructions per Cycle (IPC) across the MPI processes when in useful computation, i.e. some of the processes were completing their work at a faster rate than others.
 This results in idle time for the quicker processes while waiting for the others to catch up.
The slowdown on some processes was due to higher cache miss rates, resulting in longer times fetching data. To improve the cache usage, we suggested improving the temporal and spatial locality of the data. In this case, the decomposition of the model into cells for parallelisation in the initialisation led to the data within a cell being located far apart in memory. The solution was to renumber the mesh after the decomposition to ensure that data that is close in memory is also used close in time, making better use of the cache and avoiding long delays fetching data.
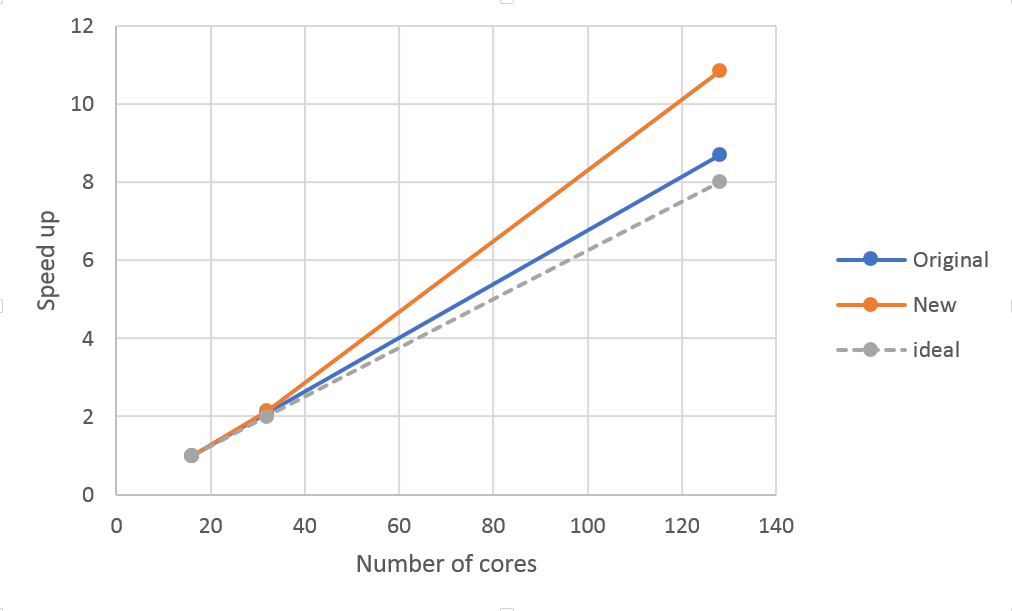
Due to this improvement, the application showed a 25% reduction in time-to-solution on a 128 MPI process execution.
2x performance improvement for SCM ADF code
ADF is the flagship code from Software for Chemistry and Materials (SCM), a company based in The Netherlands. It is a computational chemistry application which uses density functional theory calculations to predict the structure and reactivity of molecules. A POP Audit and Performance Plan (now one report known as an Assessment) were carried out on their new Hartree-Fock exchange implementation which is an important new feature of the application. The application uses MPI and shared memory within a node to parallelise the problem.
The main issue identified was the load imbalance due to unequal distribution of work. There was also low computational scalability but that was found to be an artefact of the time processes spent idle waiting to be distributed work. The communication efficiency was found to be good and did not need further investigation. A recommendation was made to improve the load balancing algorithm with an expected performance improvement of a factor of two for good load balance.
Shown below is the original timeline of load balance for Hartree-Fock exchange. The y-axis is the MPI process number and communication lines are shown in black.
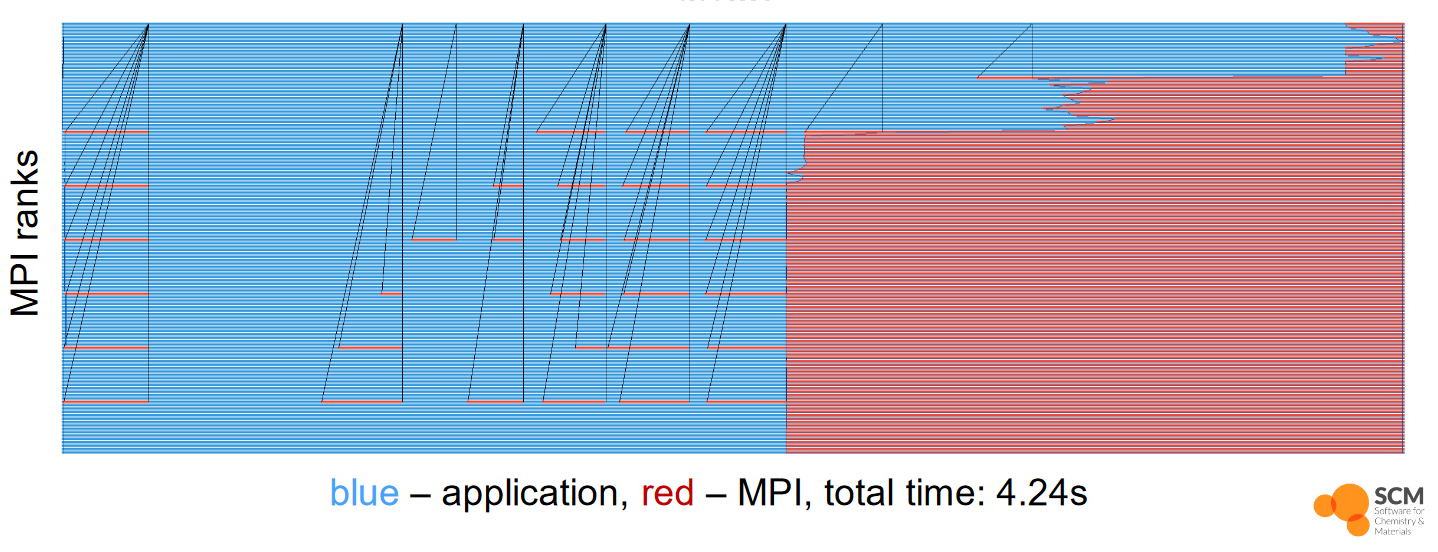
On 128 processes the section of imbalanced work took 4.24 seconds for 45 atoms. Dynamic load balancing was implemented by the SCM developers with a dedicated dispatcher process to distribute the work to all other processes. This reduced the runtime to 1.992 seconds, a performance improvement of over 2, as was estimated in the POP Performance Plan. The full report of the performance plan of the ADF code can be found here.
Apply for free help with code optimisation
We offer a range of free services designed to help EU organisations improve the performance of parallel software. If you are not getting the performance you need from parallel software or would like to review the performance of a parallel code, please apply for help via the short Service Request Form, or email us to discuss the service further and how it can be beneficial.
These services are funded by the European Union Horizon 2020 research and innovation programme so there is no direct cost to our users.
The POP Helpdesk
Past and present POP users are eligible to use our email helpdesk (pop-helpdesk@bsc.es). Please contact our team of experts for help analysing code changes, to discuss your next steps, and to ask questions about your parallel performance optimisation.